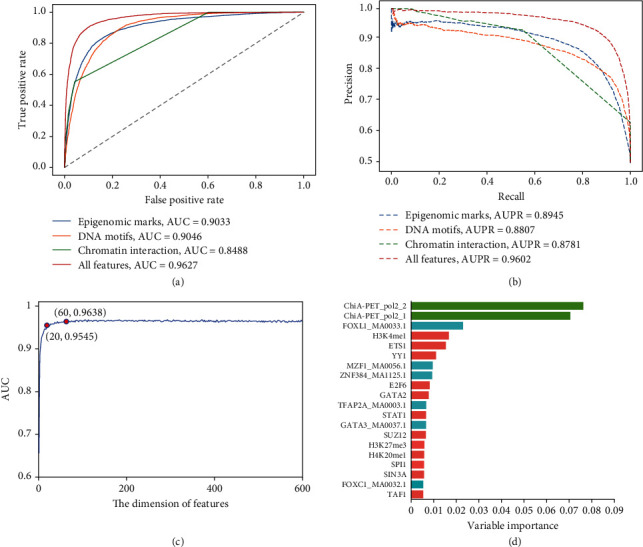
Figure 3.

Prediction of ORIs using epigenomic data, DNA motifs, and ChIA-PET data by random forests. (a) Receiver operating characteristic (ROC) curve and (b) precision-recall (PR) curves for four different feature sets are plotted, in which area under the ROC curves (AUCs) and areas under the PR curves (AUPRCs) also are marked. (c) A plot showing the feature selection procedure for identifying ORIs based on 626-dimension features. When the top 60 features optimized by VI scores were used to perform prediction, the AUC nearly reaches IFS peak of 0.9638. At the same time, only the top 20 features can also produce a satisfactory model with an AUC value of 0.9545. (d) The top 20 variable importance values for all features included epigenomic marks, DNA motifs, and chromatin interaction.
