
Fig. 2. Effect of augmented ICR on somatic and dendritic spatial tuning properties in single CA1PNs.
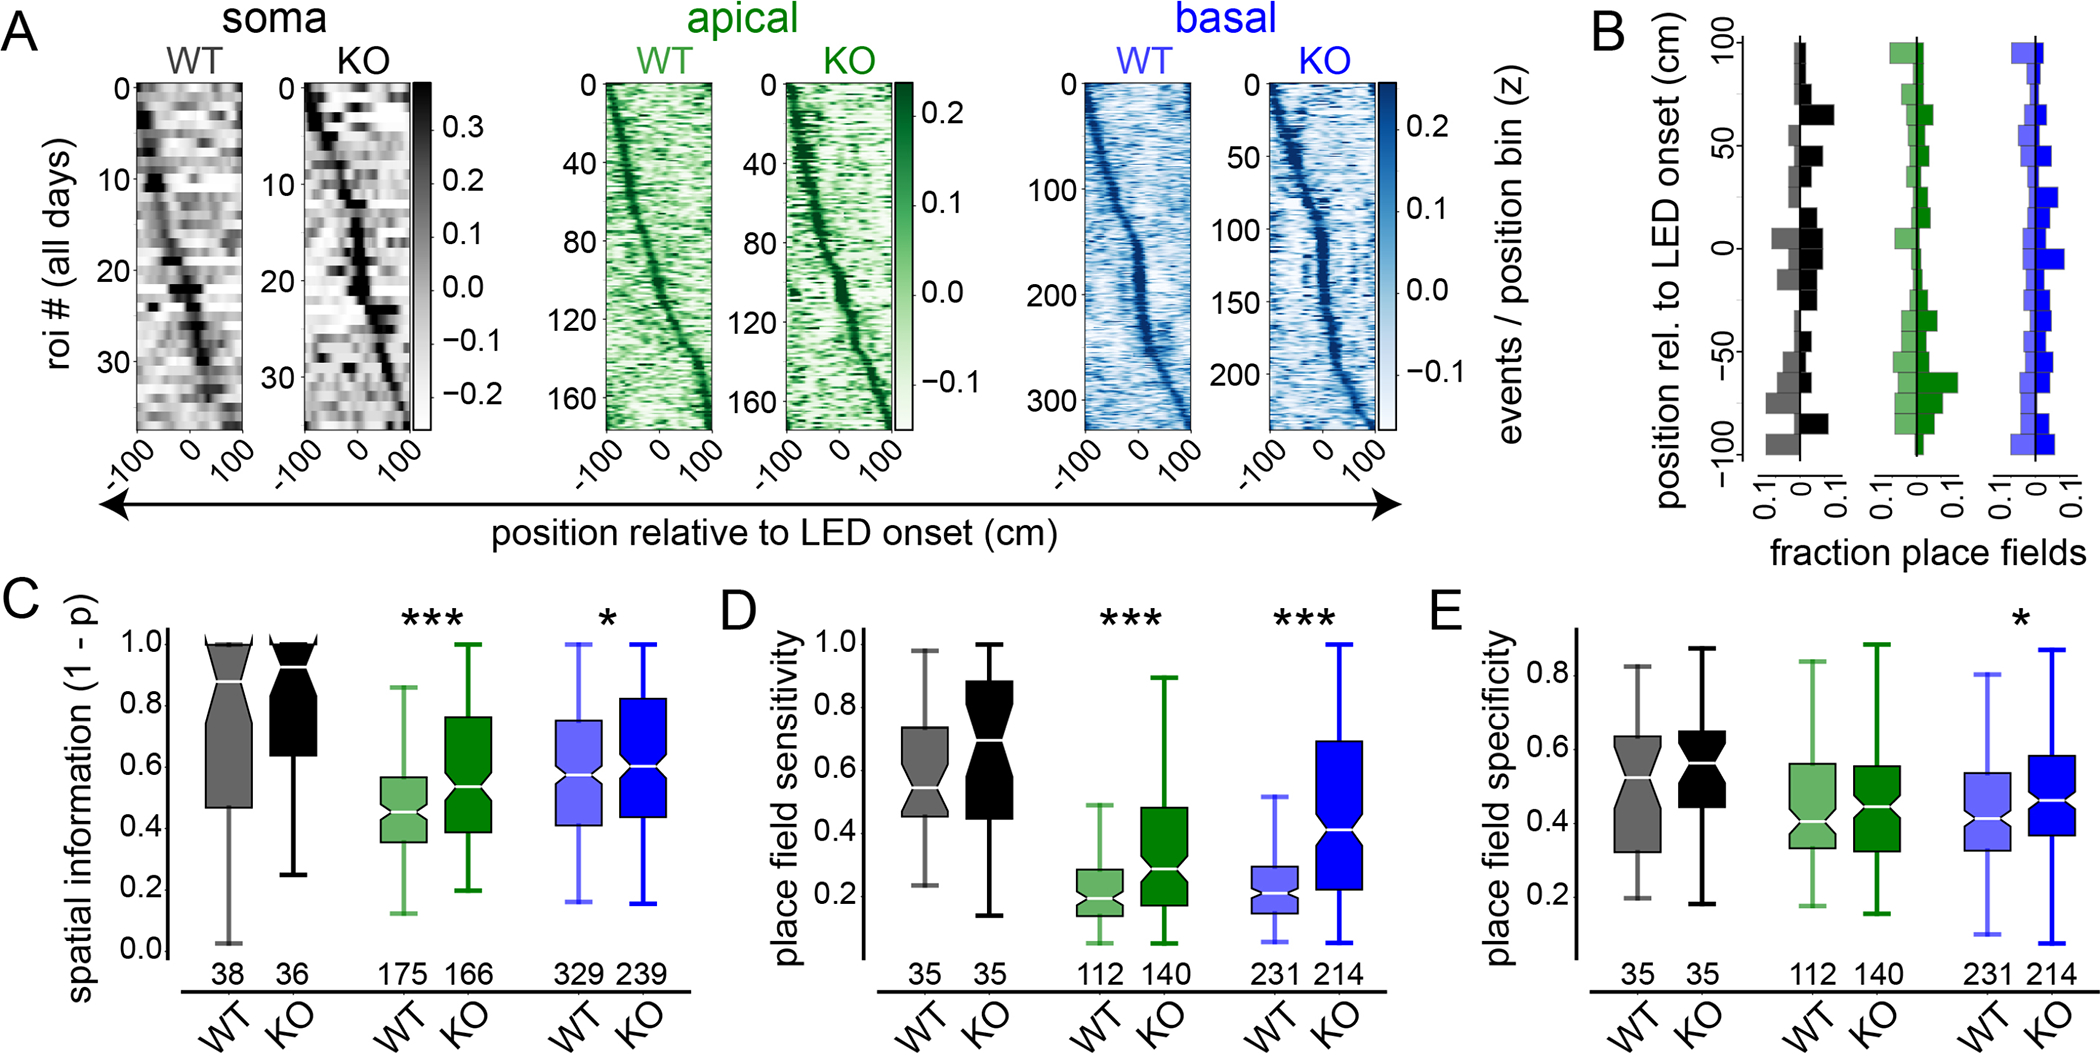
(A) Spatial activity heatmaps showing LED-centered spatial tuning curves for all Pdzd8 WT and WT somatic (greys), apical (greens), and basal (blues) ROIs imaged across all days, sorted by tuning curve peak location. (B) Mirrored vertical histograms showing distribution of place field (PF) center locations relative to LED onset for Pdzd8 WT (transparent; left of x-axis) and WT (opaque; right of x-axis) for somatic, apical, and basal ROIs color-coded as in (A). (C-E) PF metrics, including spatial information (C), PF sensitivity (D), and PF specificity (E), shown for all ROI type-genotype combinations. Boxes range from lower to upper quartiles with line at median; whiskers show range of data within 1.5 * (Q3 - Q1) of box boundaries. For panels (A-C), N represents total number of ROIs imaged across days (see Table S1 and Methods for details). For panels (D, E), N represents total number of ROIs with significant spatial tuning across days. Two-sided unpaired t-tests and Mann-Whitney U tests were used. p < 0.05*, 0.001***.