
Figure 5. Tregs orchestrate cardiac inflammation resolution.
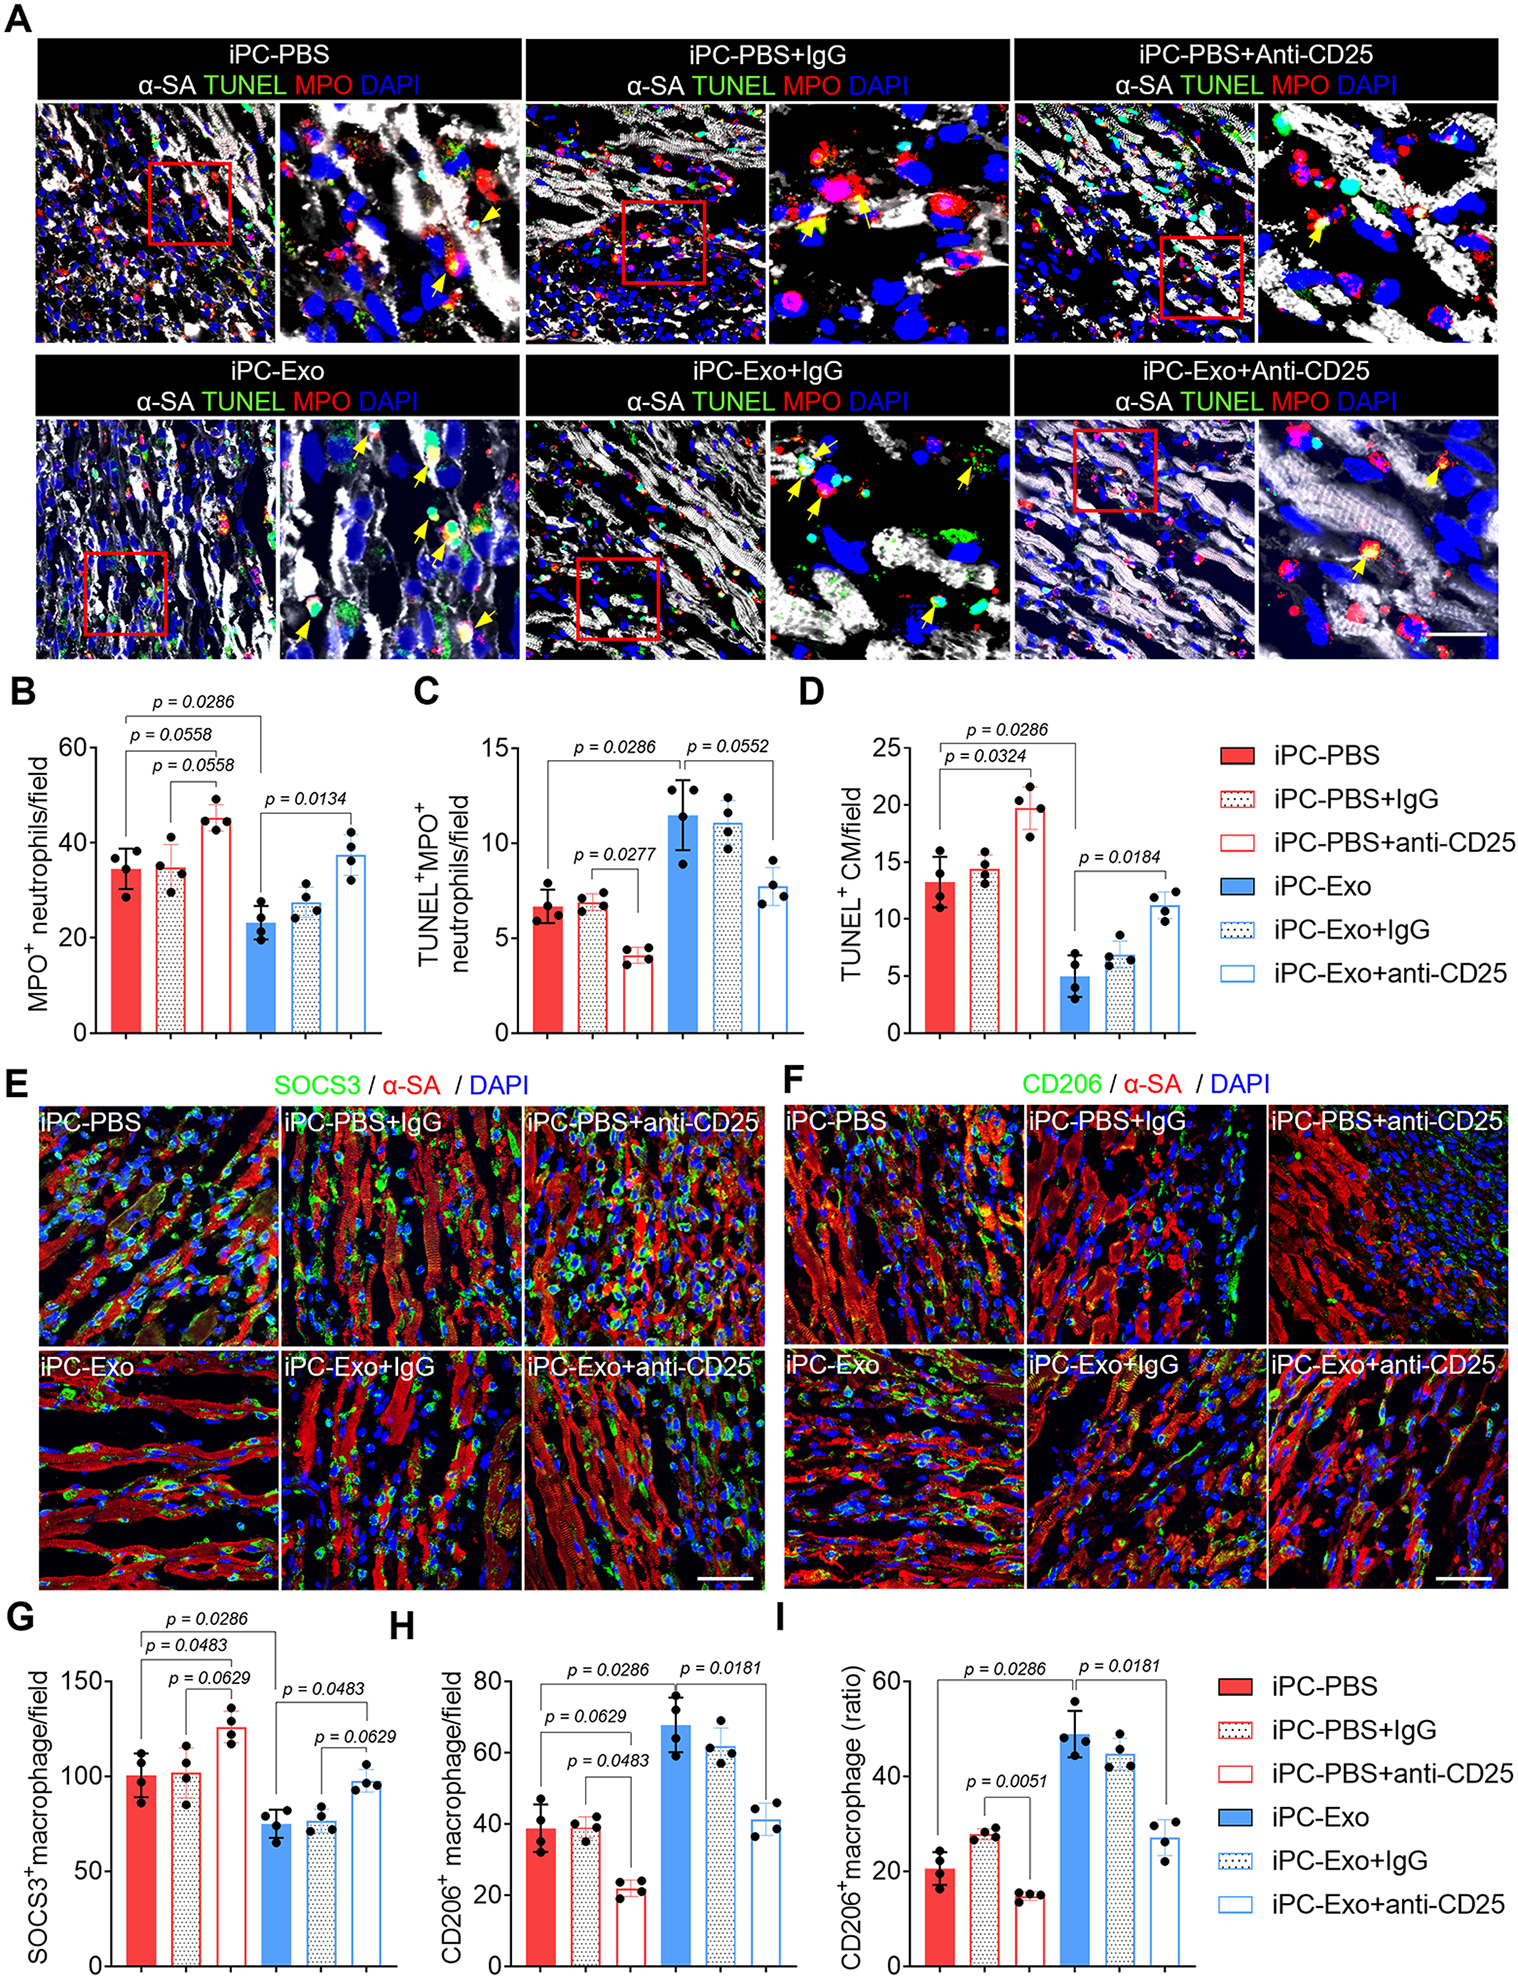
(A) Detection of neutrophils apoptosis by TUNEL assay. Scale bar, 60μm. (B-C) Quantitative analysis of neutrophils apoptosis. (D) Detection of cardiomyocyte apoptosis by TUNEL assay. (E-I) Detection of macrophage polarization, and accordingly, the counts of SOCS3+ and CD206+ macrophages as well as the CD206+ macrophage ratio in the total macrophages was calculated (I). Scale bar, 60μm. Quantitative data was shown as mean ± SD, n=4 animals for each group. p value was determined by Kruskal-Wallis’s test with Dunn’s correction and nonparametric Mann-Whitney test (iPC-PBS v.s. iPC-Exo) for B-D, G-I.