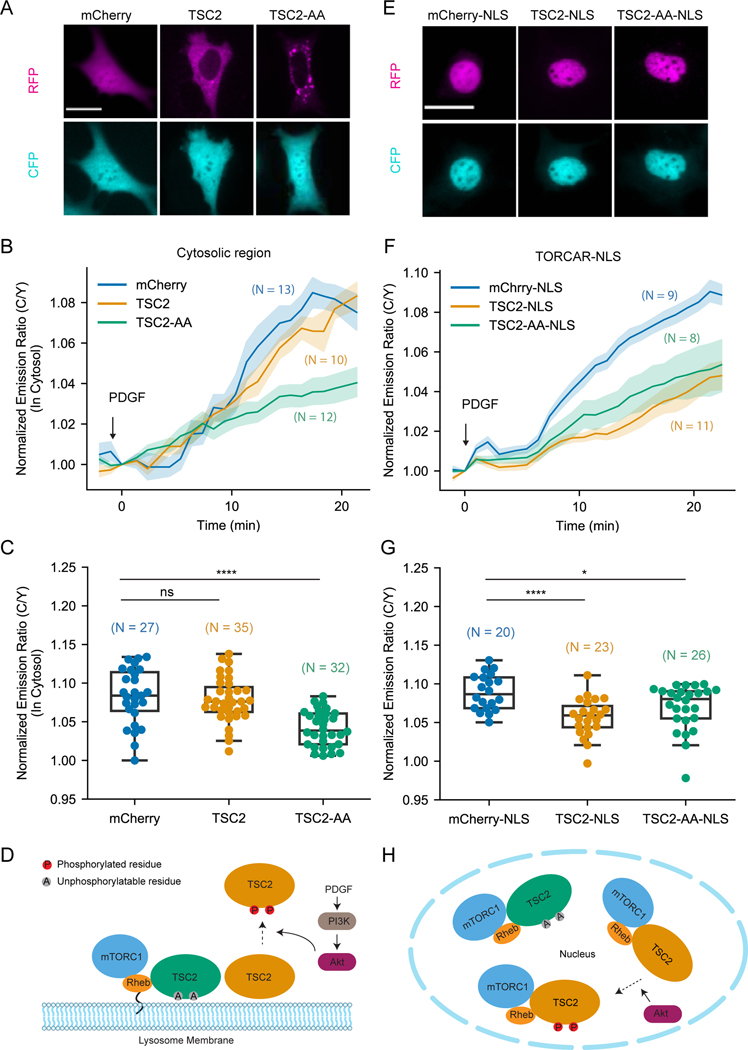
Figure 2. Growth factor induced nuclear mTORC1 activity is suppressed by overexpressing TSC2 in the nucleus.
(A) Representative fluorescence images from three independent experiments showing the localization of overexpressed constructs in NIH3T3 cells. Fluorescence of mCherry, mCherry-TSC2 and mCherry-TSC2-AA mutant are shown as “RFP”. “CFP” shows fluorescence of TORCAR. (B-C) Representative averaged time course traces (B) and summary (C) of PDGF-induced maximum responses of TORCAR in the cytosolic regions of double starved NIH3T3 cells. mCherry (blue, N = 27); mCherry-TSC2 (yellow, N = 35); mCherry-TSC2-AA (green, N = 32). (D) Model depicting lysosomal TSC2-dependent spatial regulation of mTORC1 activation. (E) Representative fluorescence images from three independent experiments showing the localization of overexpressed nuclearly targeted constructs in NIH3T3 cells. Fluorescence of mCherry-NLS, mCherry-TSC2-NLS and mCherry-TSC2-AA-NLS mutant are shown as “RFP”. “CFP” shows the fluorescence of TORCAR-NLS. (F-G) Representative averaged time course traces (F) and summary (G) of PDGF-induced maximum responses of TORCAR-NLS in double starved NIH3T3 cells. Co-expressed constructs: mCherry-NLS (blue, N = 20); mCherry-TSC2-NLS (yellow, N = 23); mCherry-TSC2-AA-NLS (green, N = 26). (H) Model depicting the inhibition of nuclear mTORC1 activity by overexpressed nuclear TSC2. N indicates the cell number quantified from at least 3 independent experiments. Shaded areas indicate standard error of the mean (SEM). Box plots show the upper and lower adjacent values, interquartile range and the median. Scale bar = 10 µm. See also Figure S2.

