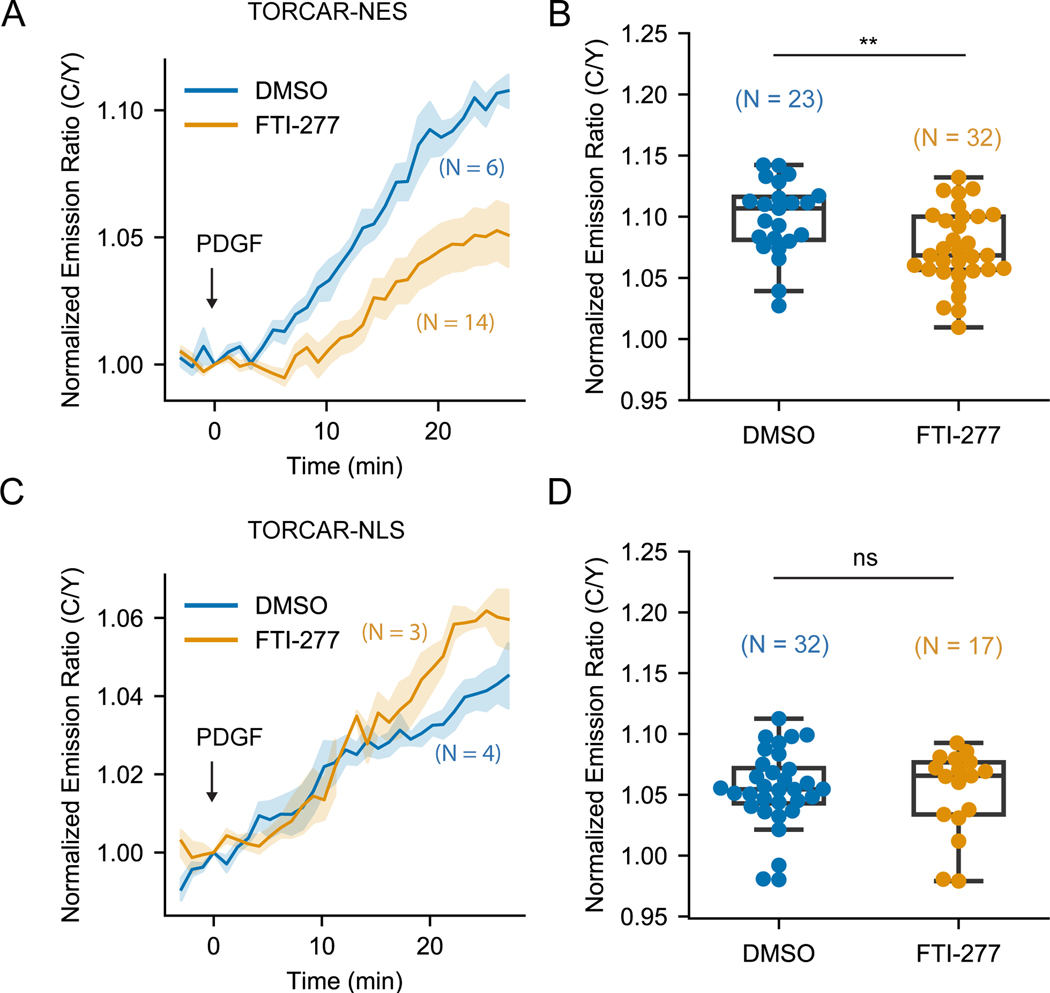
Figure 3. Farnesyltransferase inhibitor FTI-277 did not affect nuclear mTOR1 activity.
(A-B) Representative averaged time course traces (A) and summary (B) of PDGF-induced maximum responses of TORCAR-NES in double starved NIH3T3 cells treated with DMSO (blue, N = 23) or farnesyltransferase inhibitor FTI-277 at 5 µM overnight (yellow, N = 32). (C-D) Representative averaged time course traces (C) and summary (D) of PDGF-induced maximum responses of TORCAR-NLS in double starved NIH3T3 cells treated with DMSO (blue, N = 32) or farnesyltransferase inhibitor FTI-277 at 5 µM overnight (yellow, N = 17). N indicates the cell number quantified from at least 3 independent experiments. Shaded areas indicate standard error of the mean (SEM). Box plots show the upper and lower adjacent values, interquartile range and the median. See also Figure S3.

