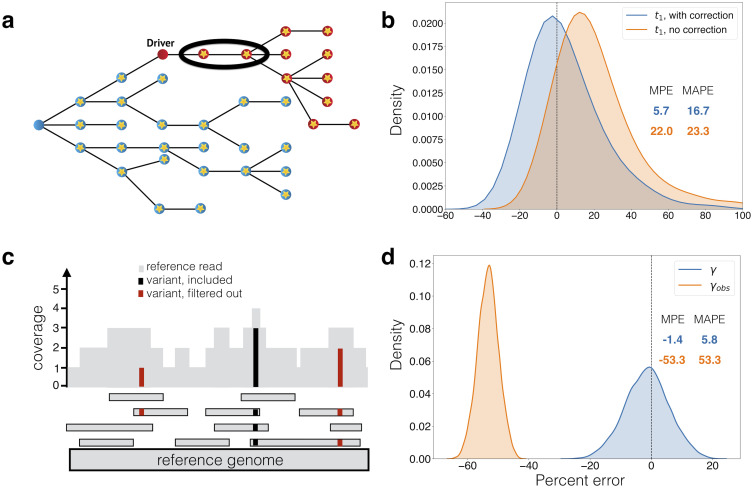
Fig 3. Corrections for observed mutation counts.
(a) If passenger mutations (circles with stars) that occur after the driver reach fixation in the driver population (red), then they are indistinguishable from the passengers that were present in the first cell with the driver, which accrued in the type-0 population (blue). The estimate of when the driver occurred needs to account for these mutations (circled). In (b), we compare percent errors of parameter estimates for time from tumor initiation until appearance of a driver subclone, t1, with and without this correction (Eq (6)). Errors for estimate with correction are shown in blue, and for estimate without correction (Eq. (5)) in orange. Errors are plotted as a kernel density estimate for Monte Carlo simulations of slow-growing tumor with mutation rate u = 5. Mean percent errors (MPEs) and mean absolute percent errors (MAPEs) are listed. (c) Mutations present on two or fewer variant reads (red) are filtered out in post-processing. Mutations with more than two variant reads (black) are included. The number of subclonal mutations between frequencies f1 and f2, γ, which is used in the mutation rate estimate, must be corrected for mutations that are filtered out. In (d), the percent errors for the observed (orange) and corrected (blue) γ (Eq (7)) are plotted as kernel density estimates. Observed mutations are those that passed post-processing, i.e. those that have more than L = 2 mutant reads. True mutation frequencies were generated from 135 surviving runs of a Monte Carlo simulation of a fast-growing tumor with mutation rate u = 1, from which sequencing reads were simulated with 200x average coverage (see Materials and methods). Percent errors are calculated relative to the true γ measured from the true mutation frequencies.

