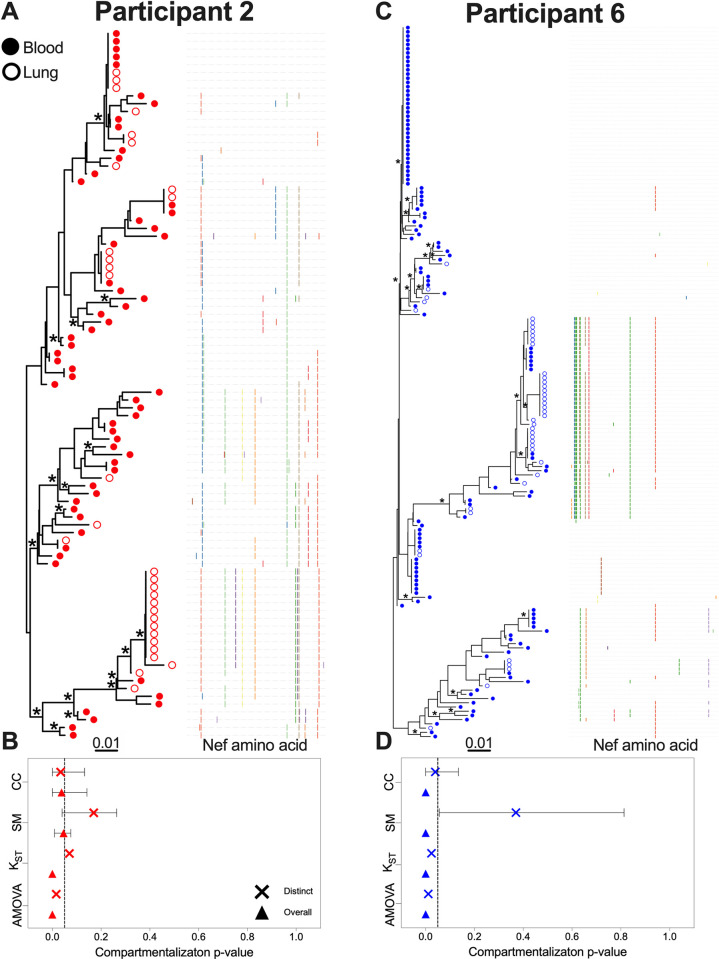
Fig 2. Within-host phylogenies and compartmentalization results for participants 2 and 6.
Each participant’s top panel shows the highest likelihood phylogeny derived from Bayesian inference, rooted at the midpoint. Filled circles denote blood sequences; open circles denote lung sequences. Asterisks identify nodes supported by posterior probabilities ≥70%. The adjacent plot shows amino acid diversity of each sequence, with coloured ticks denoting non-synonymous substitutions with respect to the sequence at the top of the phylogeny. The bottom panel shows p-values of the four tests of genetic compartmentalization between blood and lung (AMOVA = Analysis of Molecular Variance; KST = Hudson, Boos and Kaplan’s nonparametric test for population structure; SM = Slatkin-Maddison test; CC = Correlation Coefficient test). The "×" symbol shows the p-value based on distinct sequences per compartment, and the triangle shows the p-value based on overall sequences. For SM and CC tests, the bars represent the 95% HPD interval of the p-value derived from all 7,500 trees.

