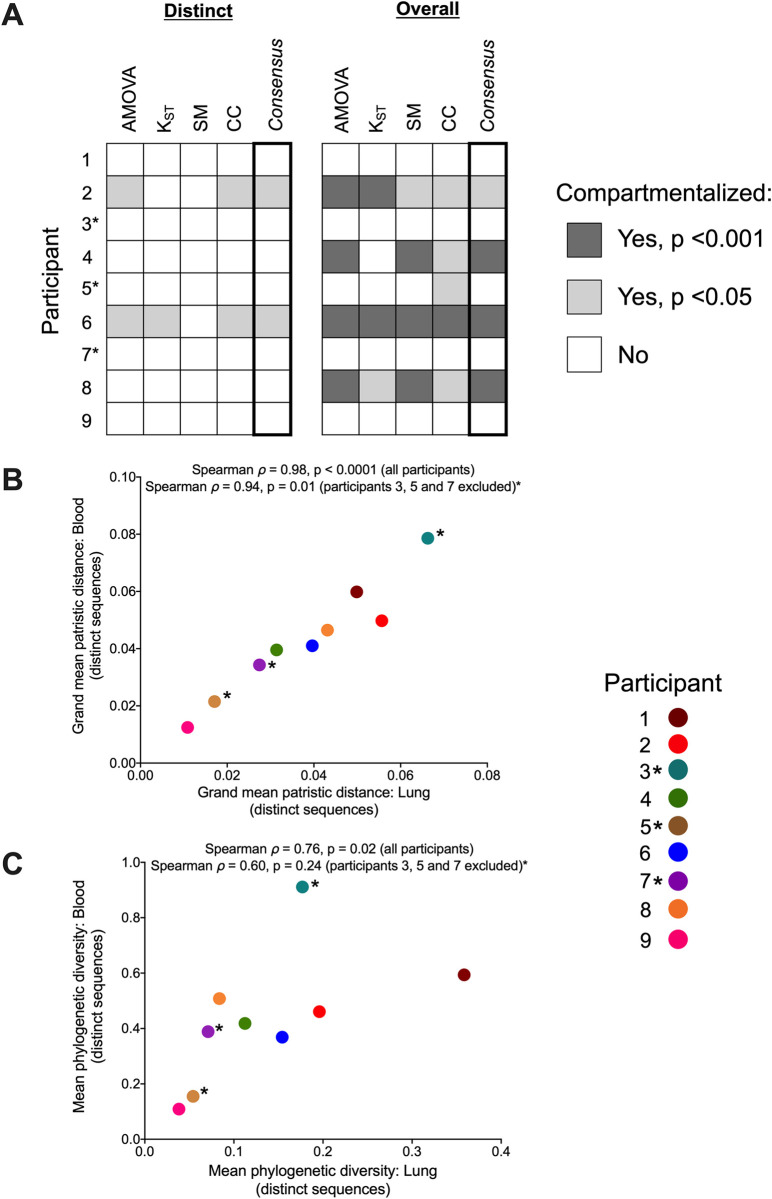
Fig 5. Summary of genetic compartmentalization results and blood-lung proviral diversity.
(A) Summary of genetic compartmentalization results for the four tests used, along with the "consensus" result, where a dataset is declared compartmentalized if at least one test per type (genetic distance vs. tree-based) gave a statistically significant result. Dark grey squares denote compartmentalization with p<0.001, light grey squares denote compartmentalization with p<0.05; white squares denote no compartmentalization. The "Distinct" panel summarizes compartmentalization results when limiting analysis to distinct sequences per compartment; the "Overall" panel summarizes results when all sequences are included. (B) Spearman’s correlation between blood and lung proviral diversity, where values represent the grand mean of within-host patristic distances separating all pairs of distinct sequences per compartment, averaged over all 7,500 trees per participant. Spearman’s correlation and p-values were computed across all participants and after excluding participants 3, 5, and 7 (shown by asterisks). (C) Spearman’s correlation between blood and lung proviral diversity, where values represent mean phylogenetic diversity of distinct sequences per compartment, computed from all 7,500 trees per participant.

