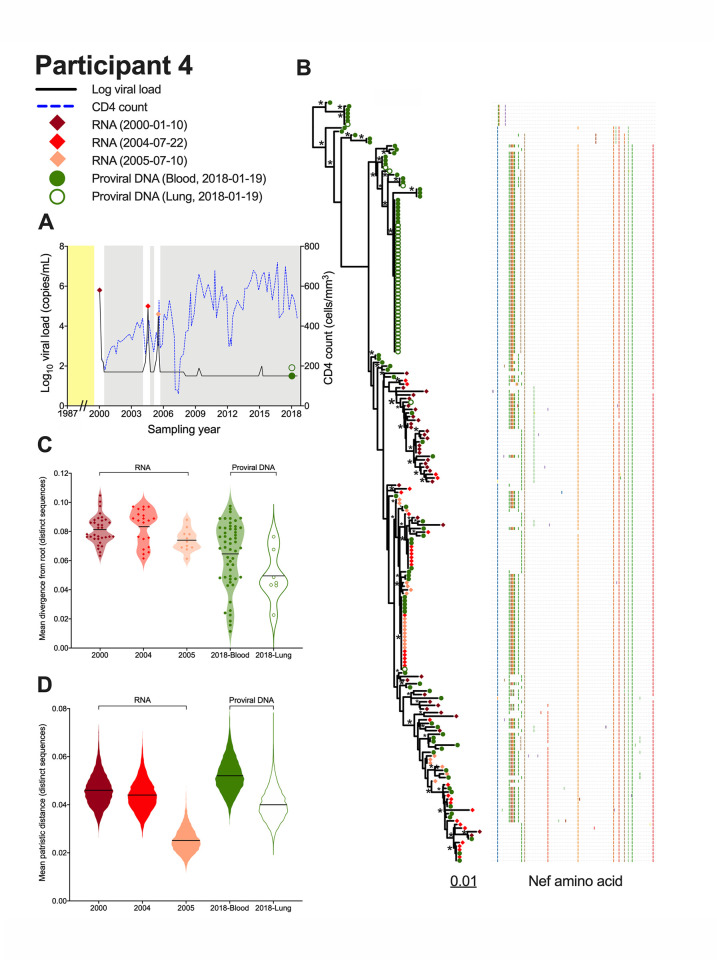
Fig 6. Interpreting proviral diversity in context of prior within-host HIV evolution: participant 4.
(A) Plasma viral load (solid black line), CD4+ T-cell count (dashed blue line) and samples analyzed (colored diamonds and circles). Yellow shading denotes period following infection where no clinical information is available. Grey shading denotes periods of suppressive ART. (B) Highest likelihood phylogeny derived from Bayesian inference, outgroup rooted. Scale shows estimated substitutions per nucleotide site. The adjacent plot shows amino acid diversity, with coloured ticks denoting non-synonymous substitutions with respect to the reference sequence at the top of the tree. Asterisks identify nodes supported by posterior probabilities ≥70%. (C) Mean divergence from the root of each distinct sequence, averaged over all 7,500 trees, stratified by sampling date and sample type. The black line represents the grand mean. (D) Within-host HIV sequence diversity, calculated as the mean patristic distance between all distinct sequences collected at that time point for that sample, where the values for each of the 7,500 trees are represented as a violin plot. The black line represents the grand mean.

