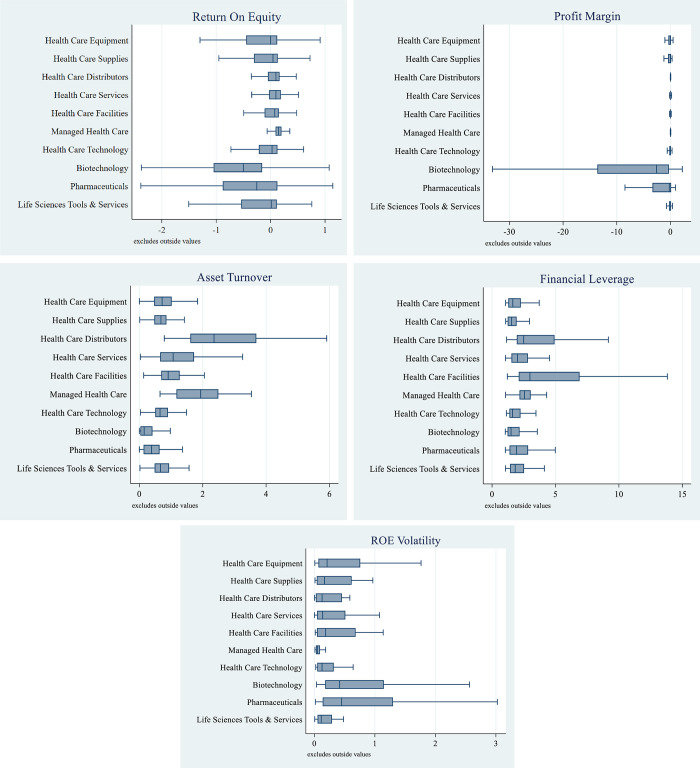
Fig 1. Firm performance across health care industries.
A: Return on Equity (ROE), B: Profit Margin, C: Asset Utilization, D: Financial Leverage, E: ROE Volatility. Notes: Box plot lines represent the 25th percentile, median, and 75th percentile. Whiskers are 1.5 times the interquartile range. Return on Equity (ROE), Profit Margin (PM), Asset Utilization (ATO) and Financial Leverage (LEV) are calculated for each company in each fiscal year. The total sample is comprised of 6,106 company-years of data from 2010 to 2019. Return on Equity is net income divided by the average of beginning and ending book value of equity. Profit Margin is net income divided by revenue. Asset Utilization is revenue divided by the average of beginning and ending total assets. Financial Leverage is the average of beginning and ending total assets divided by the average of beginning and ending book value of equity. ROE Volatility (ROE_VOL) is the standard deviation of annual ROEs for each company during 2010–2019.

