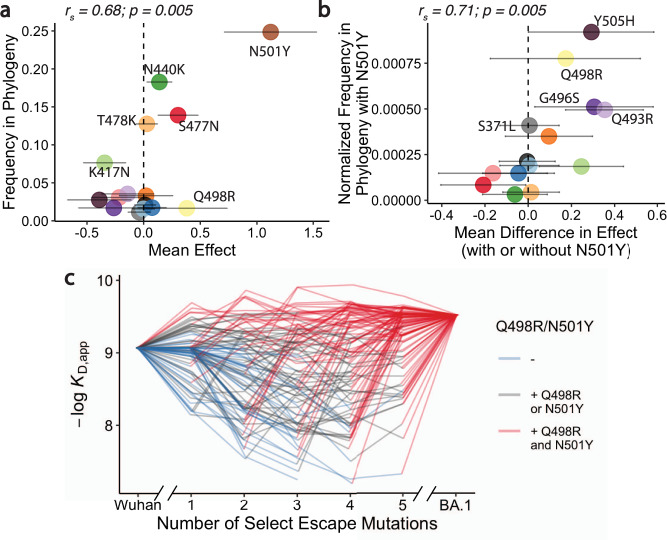
Fig. 4. Trajectory of Omicron BA.1 evolution.
a Frequency of occurrences for each mutation across SARS-CoV-2 sequences available on GISAID (see “Methods”) as a function of their average effect on ACE2 affinity in our data. Error bars indicate standard deviation of effect sizes and are centered on the mean (n=16384 backgrounds). The Spearman’s rank correlation coefficient (rs) is indicated in the top-left. (b) Normalized frequency of mutations co-occurring with N501Y across SARS-CoV-2 sequences available on GISAID (calculated based on the frequency at which each mutation occurs on the same branch as N501Y, normalized by their overall frequency; see “Methods”) as a function of the difference in their effect on ACE2 affinity in the presence of N501Y. Error bars indicate standard deviation of effects and are centered on the mean (n=8096 backgrounds). The Spearman’s rank correlation coefficient (rs) is indicated in the top-left. c ACE2 affinity trajectories for 100 randomly selected pathways (involving all 15 mutations), shown as a function of the number of mutations with strong effect on antibody escape (K417N, G446S, E484A, Q493R, and G496S) and the presence or absence of compensatory mutations Q498R and N501Y (shown with colors). Each trajectory represents a possible mutation order, starting at the Wuhan Hu-1 genotype and ending at Omicron BA.1.

