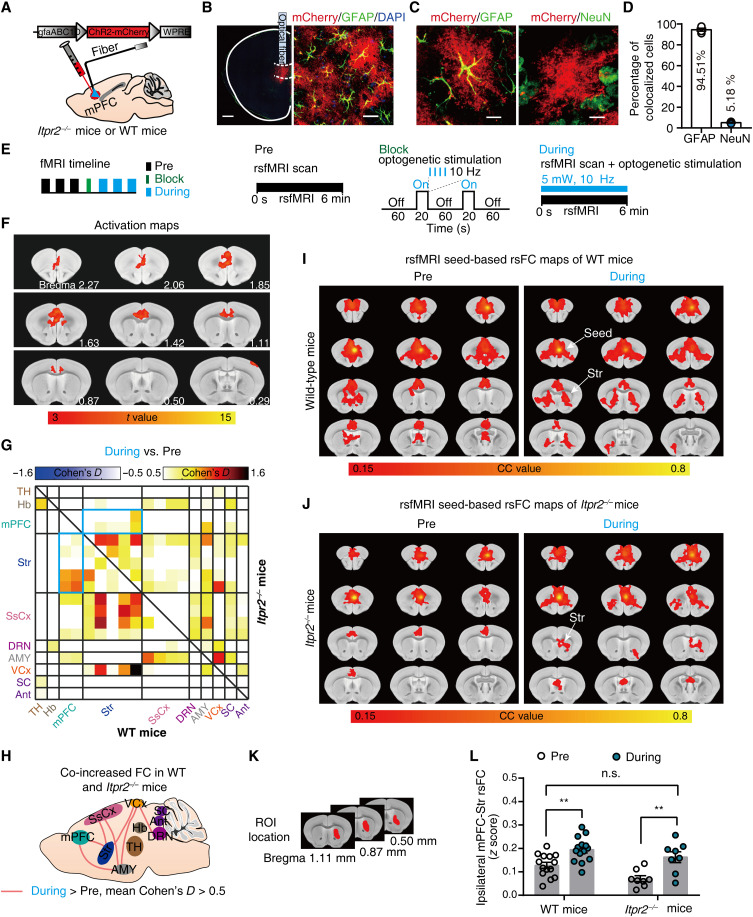
Fig. 3. Optogenetic stimulation of mPFC astrocytes increases rsFC within depression-related networks.
(A) Schematic showing the virus injection and optical fiber implantation. (B) Confocal images demonstrate ChR2 expression in mPFC astrocytes. Red, ChR2-mCherry; green, GFAP; blue, 4′,6-diamidino-2-phenylindole (DAPI). Scale bars, 500 μm (left) and 25 μm (right). (C) Representative histology of ChR2-mCherry colocalized with GFAP (left) or NeuN (right). Scale bars, 10 μm. (D) Quantitative analysis of the percentage of ChR2-positive cells that colocalized with GFAP (n = 290 mCherry-positive cells; 12 fields of view; four mice) and NeuN (n = 409 mCherry-positive cells; 17 fields of view; four mice). (E) Schematics of fMRI scanning timeline and corresponding paradigms. (F) Representative activation maps at 10-Hz stimulation. (G) Effect size matrix (Cohen’s D > 0.5) showing effect of optogenetic stimulation on ipsilateral rsFC within depression-related networks in WT (n = 14; bottom-left part) and Itpr2−/− mice (n = 8; top-right part). The blue matrix box indicates the effect size of mPFC-Str rsFC. (H) Effect size schematic diagram shows co-increased ipsilateral rsFC in WT and Itpr2−/− mice. (I and J) Resting-state correlation maps of ipsilateral mPFC of WT and Itpr2−/− mice before and during optogenetic stimulation. (K) Str ROI used to extract the CC value in the rsFC maps of mPFC (I and J). (L) Quantification of ipsilateral mPFC-Str rsFC in WT and Itpr2−/− mice. Two-way analysis of variance (ANOVA) followed by Sidak’s multiple comparison test, data are expressed as means ± SEM, **P < 0.01.

