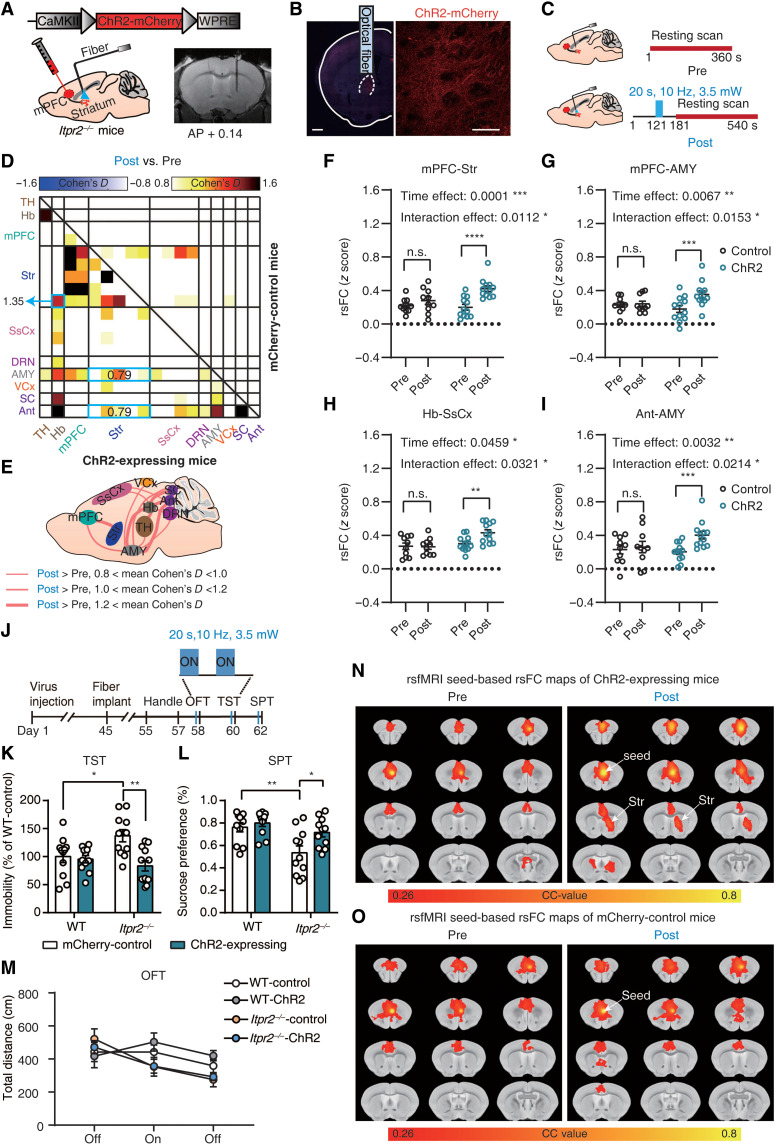
Fig. 6. Optogenetic activation of mPFC terminals in the Str partially rescues rsFC and depressive-like behaviors.
(A) Schematic showing the virus injection and optical fiber implantation. (B) Confocal images demonstrate ChR2 expression in mPFC projection to Str. Red, ChR2-mCherry; blue, DAPI. Scale bars, 500 μm (left) and 50 μm (right). (C) Schematic of optogenetic fMRI scan paradigm. Pre, pre-stimulation; Post, post-stimulation. (D) Effect size matrix showing effect of optogenetic stimulation on ipsilateral rsFC within depression-related networks of ChR2-expressing mice (n = 12; bottom-left part) and control mice (n = 10; top-right part). (E) Effect size schematic diagram of ipsilateral rsFC of ChR2-expressing mice. (F to I) Quantitative analyses of ipsilateral mPFC-Str, mPFC-AMY, Hb-SsCx, and Ant-AMY rsFC before and after optogenetic stimulation. Two-way ANOVA with Sidak’s multiple comparison test. (J) Experimental timeline for behavioral tests. (K to M) Behavioral performances of Itpr2−/− and WT mice in TST (n = 11, 11, 11, and 12 for WT control, WT ChR2, Itpr2−/− control, and Itpr2−/− ChR2 mice, respectively), SPT (n = 11 mice in each group), and OFT (n = 11, 11, 11, and 12 for WT control, WT ChR2, Itpr2−/− control, and Itpr2−/− ChR2 mice, respectively) after optogenetic activation of mPFC-Str projection. Two-way ANOVA followed by Sidak’s multiple comparison test. All data are expressed as means ± SEM. *P < 0.05, **P < 0.01, ***P < 0.001, and ****P < 0.0001. (N and O) Average resting-state correlation maps of ipsilateral mPFC before and after optogenetic activation of mPFC-Str projection.

