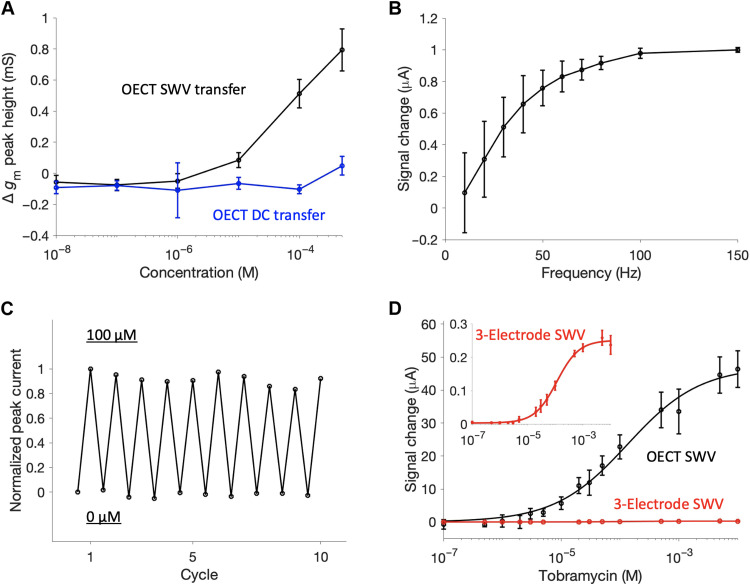
Fig. 2. Characterization of AB-OECT sensors.
(A) AB-OECT sensing behavior showing gm peak height growth with concentration using the square-wave OECT operation. The DC transfer curves do not respond to changes in analyte concentration. (B) Signal gain upon 1 mM tobramycin addition versus frequency saturates at approximately 70 Hz. (C) Peak signal change with 10 spike and rinse cycles indicates good reversibility. (D) Using identically sized gate and working electrodes (area = 0.79 mm2), calibration curves generated using the OECT current are amplified significantly versus those generated using the three-electrode SWV. For example, at saturated target concentrations, the OECT signal is amplified by nearly 200-fold relative to the current seen when an identical device is interrogated using the standard, three-electrode configuration. Error bars correspond to the SD from replicate devices (N = 3). All data in this figure were measured in 1× PBS at ambient temperature. The OECT measurements used VD = −200 mV.

