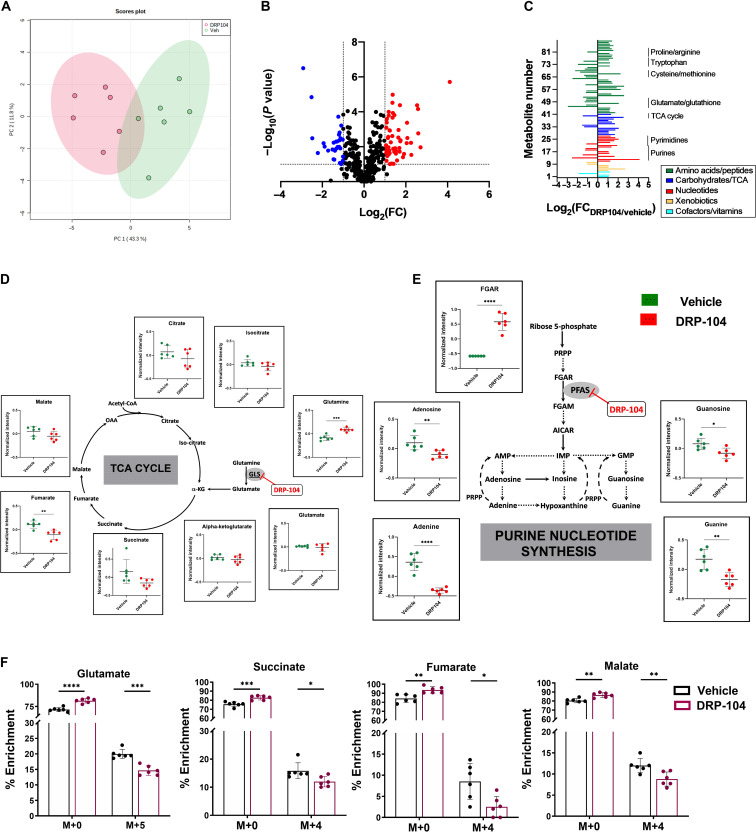
Fig. 6. Metabolomic analysis of DRP-104–treated tumors.
(A) Principal components analysis of metabolomics datasets of the EL4 tumors in the vehicle- versus DRP-104–treated mice (green = vehicle; red = DRP-104). (B) Volcano plot of metabolites identified from EL4 tumors treated with DRP-104 or vehicle. X axis is log2 (fold change DRP-104/vehicle); y axis is −log10 (P value). Metabolites with log2 fold change ≤ −1 and −log10 (P value) ≥ 1 are blue. Metabolites with log2 fold change ≥ 1 and −log10 (P value) ≥ 1 are red. All other metabolites are shown in black. (C) Individual significant (P < 0.1) metabolites (n = 88) from DRP-104 versus vehicle-treated EL4 tumors categorized by metabolic superpathways. Subpathways highlighted by black bars and text. X axis is log2 (fold change DRP-104/vehicle). Y axis is list of metabolites. (D) Major TCA cycle components affected by DRP-104 treatment. (E) Major purine nucleotide synthesis components affected by DRP-104 treatment. (*P ≤ 0.05, **P ≤ 0.01, ***P ≤ 0.001, and ****P ≤ 0.0001 based on unpaired t test.) (F) 13C5-glutamine flux analysis of DRP-104–treated tumors. Emphasis is on isotopologue enrichment of TCA cycle intermediates such as glutamate, succinate, fumarate, and malate. *P ≤ 0.05, **P ≤ 0.01, ***P ≤ 0.001, and ****P ≤ 0.0001, based on multiple t tests.

