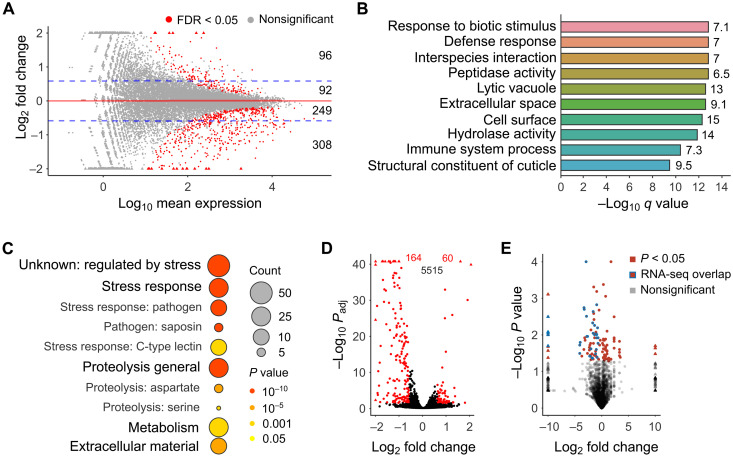
Fig. 2. Loss of tent-5 leads to the down-regulation of genes that encode innate immune effectors.
(A) MA plot illustrates differential gene expression in tent-5(tm3504) mutant compared to the wild-type worms. Statistically significant values (FDR < 0.05) are shown in red. Blue dashed lines mark the threshold of the log2(1.5) fold change. Numbers on the right indicate the number of genes differentially expressed for each fold change group. Triangles, here and (D) and (E), represent data points outside the axes limits. (B) Overrepresented functional GO terms of genes down-regulated [log2FC (log2 fold change) < −log2(1.5)] in tent-5(tm3504) mutant in comparison to the wild type. Numbers on the right indicate the enrichment fold change for each term. (C) WormCat visualization of categories enriched in genes down-regulated 1.5-fold or more in tent-5(tm3504) worms. Results are presented as scaled heatmap bubble charts, where the color signifies P values and the size specifies the number of genes in each category. (D) In the RNA-seq dataset, 5739 genes are associated with the “intestine” GO term cellular compartment (WBbt:0005772). From genes down-regulated or up-regulated in mutant worms at least 1.5-fold (A), 164 and 60 genes are associated with this GO term, respectively. Statistically significant values (FDR < 0.05) are shown in red and nonsignificant in black (n = 5515). (E) Volcano plot showing proteins, which abundance was significantly changed in mutant (red shapes, n = 114). Red shapes with blue borders represent a common part with RNA-seq results (n = 33).

