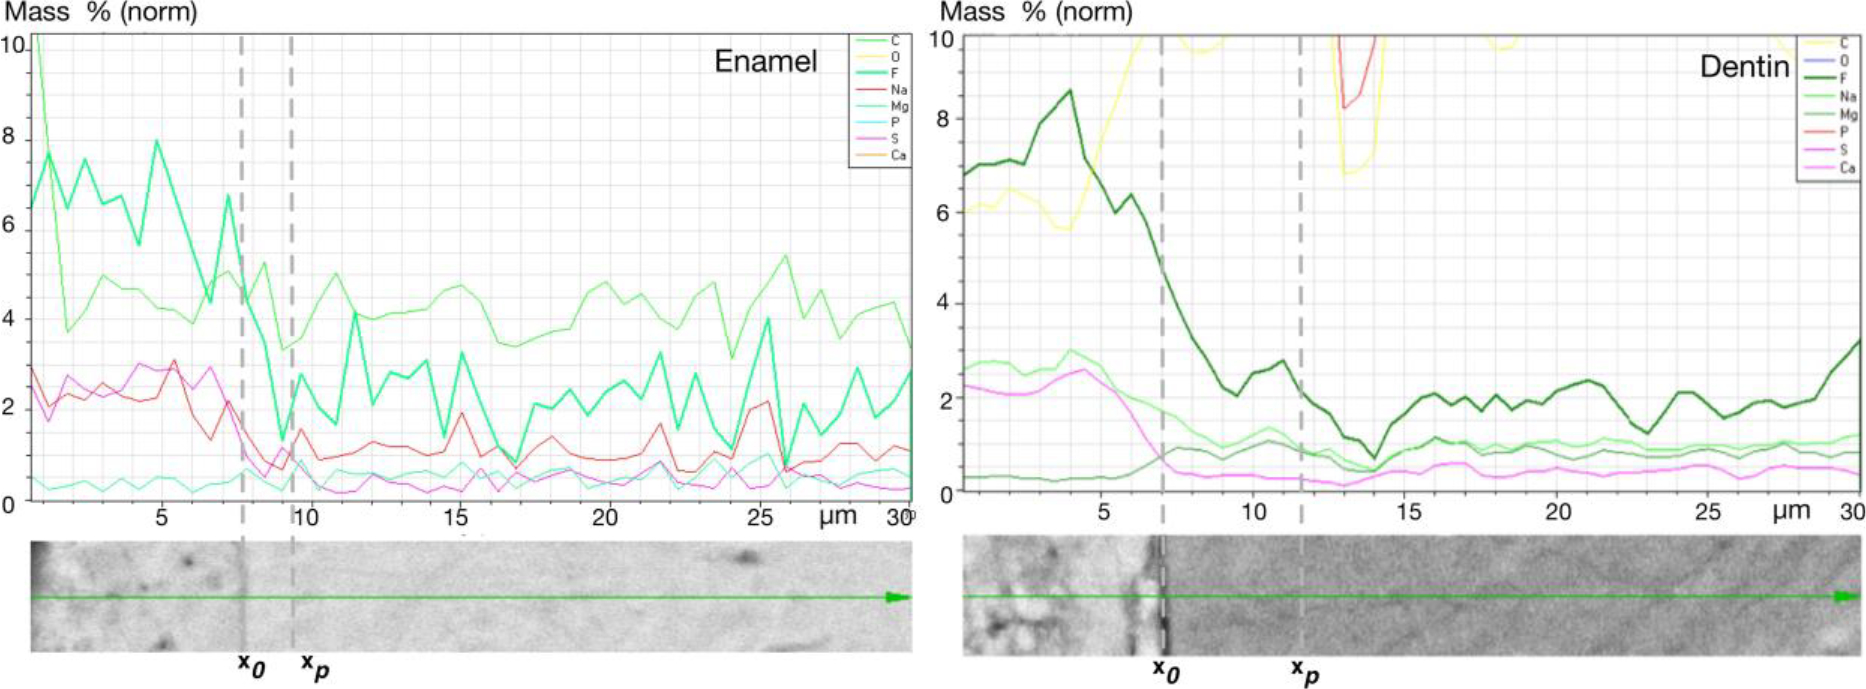
Figure 2:

SEM/EDX output of representative enamel and dentin samples after a 5-fold BIMIN application. Mass % of several elements (only results of fluoride, phosphate, and calcium are presented in the text) per measurement line (30 μm). From left to right: the first dotted line (x0) separates the BIMIN layer from the sample surface and the second dotted line (xp) limits the penetration zone in the tooth structure.
