Figure 3:

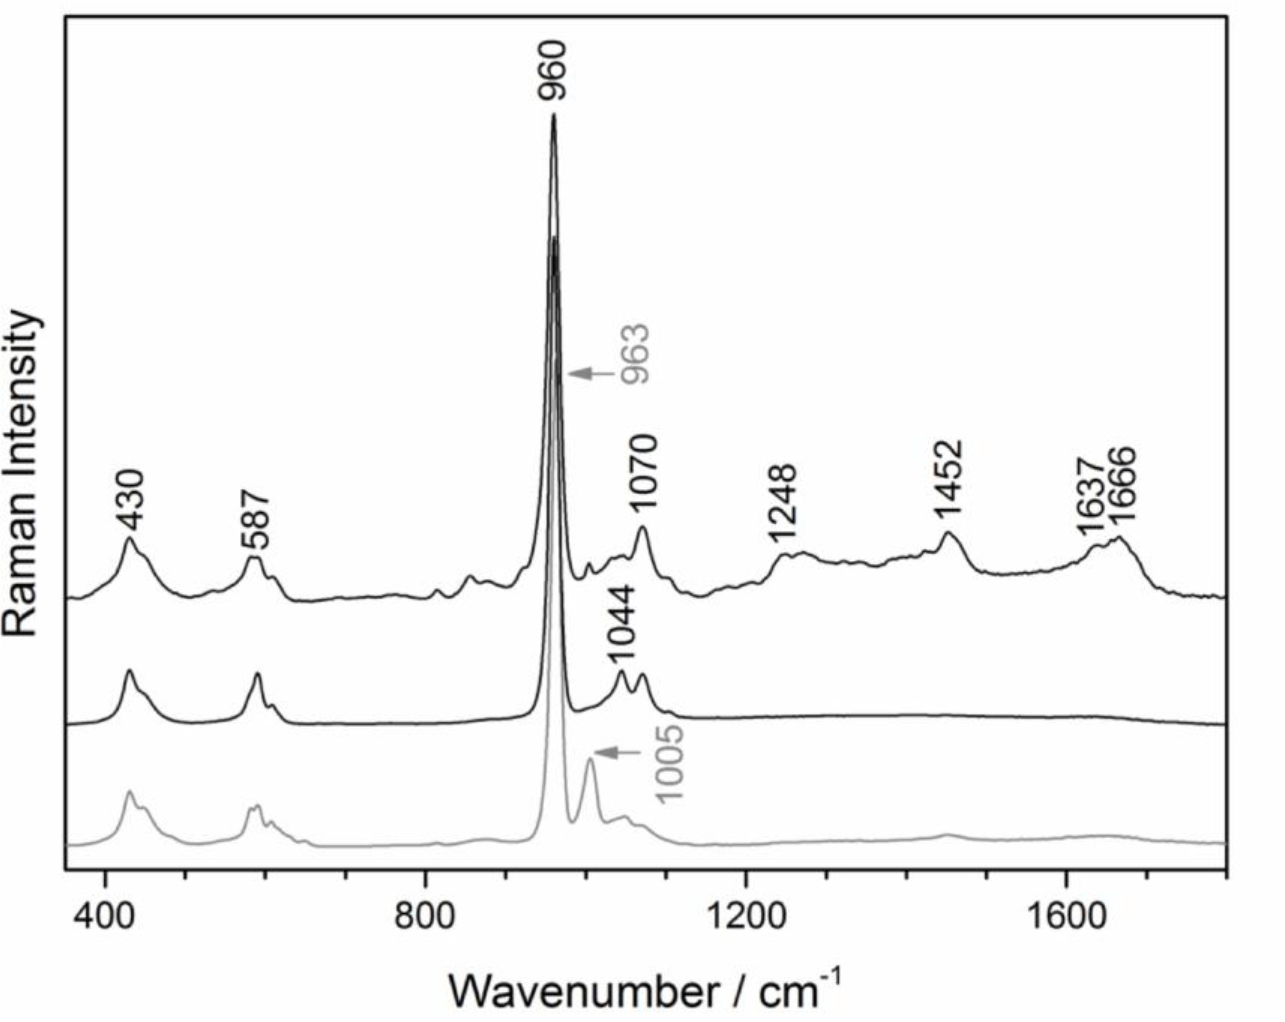
Raman spectra from 350 to 1800 cm−1 of dentin (top), enamel (middle) and BIMIN (bottom). Labeled bands are discussed in the text. Spectra are shifted to avoid overlap.

Raman spectra from 350 to 1800 cm−1 of dentin (top), enamel (middle) and BIMIN (bottom). Labeled bands are discussed in the text. Spectra are shifted to avoid overlap.