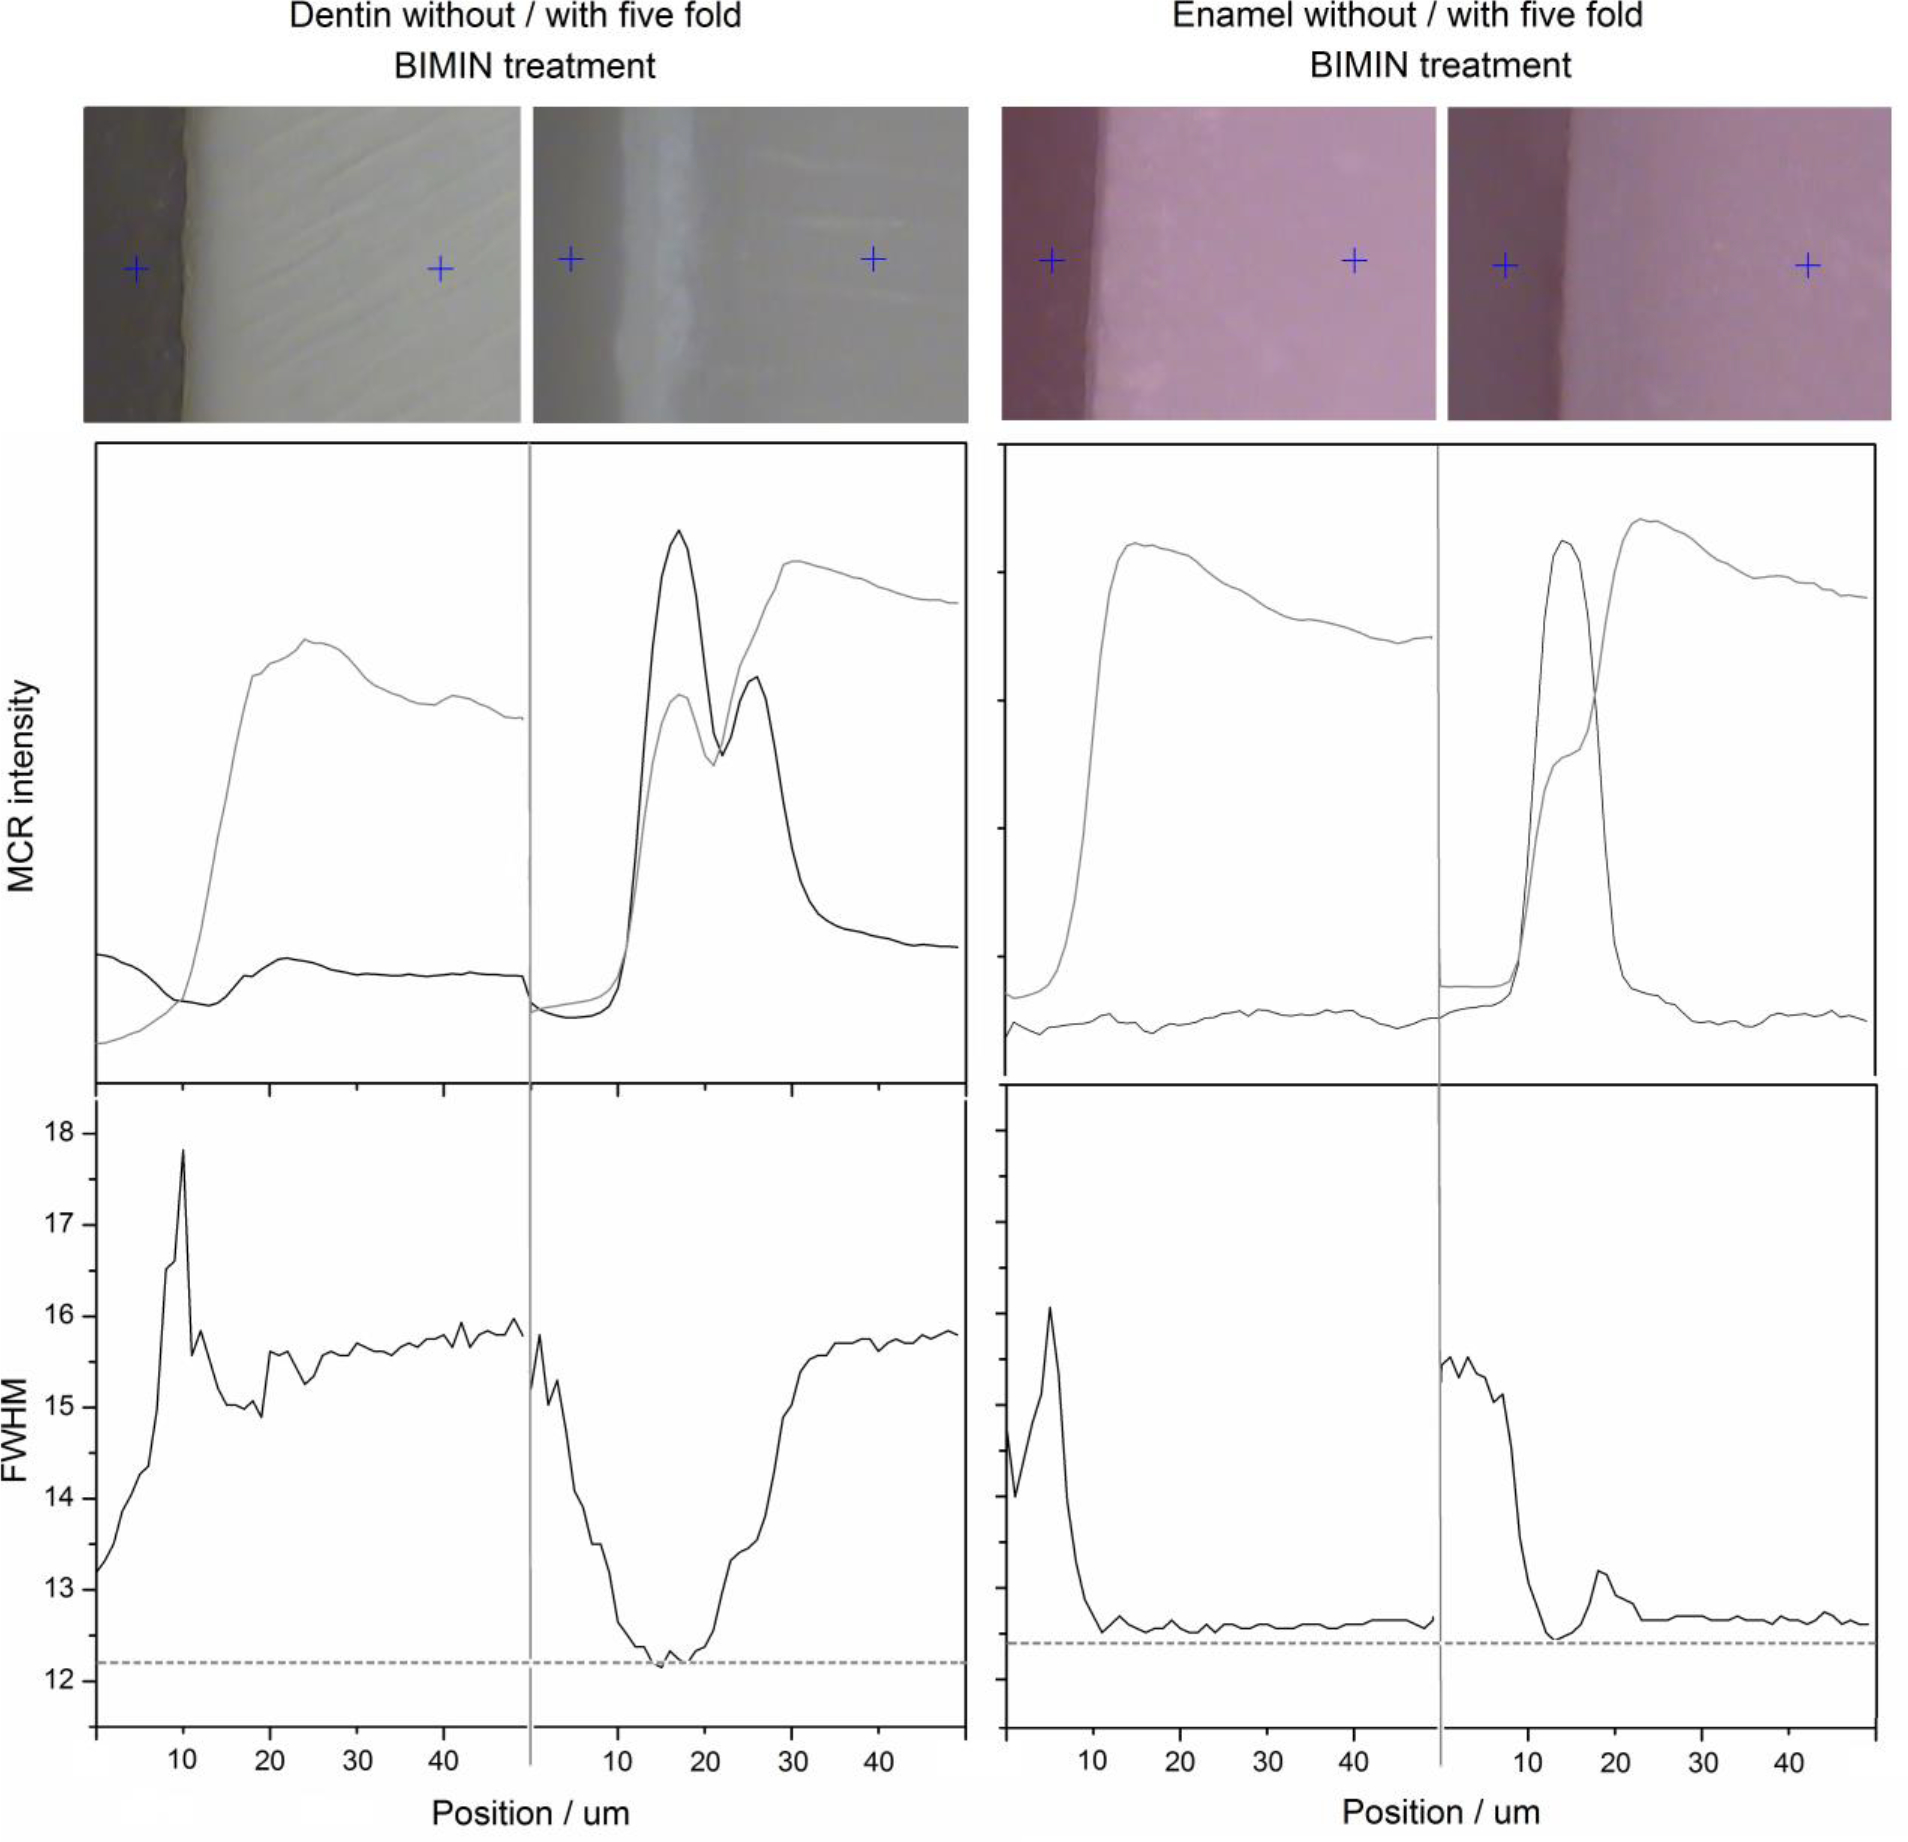
Figure 4:

Photomicrographs of dentin and enamel without and with BIMIN treatment (top row). Intensity of hydroxyapatite (gray trace) and BIMIN (black trace) components after multivariate curve resolution (MCR) analysis (middle row). Full width at half maximum of hydroxyapatite band near 960 cm−1 [30]. The distributions are plotted as a function of the lines from 0 to 50 μm.
