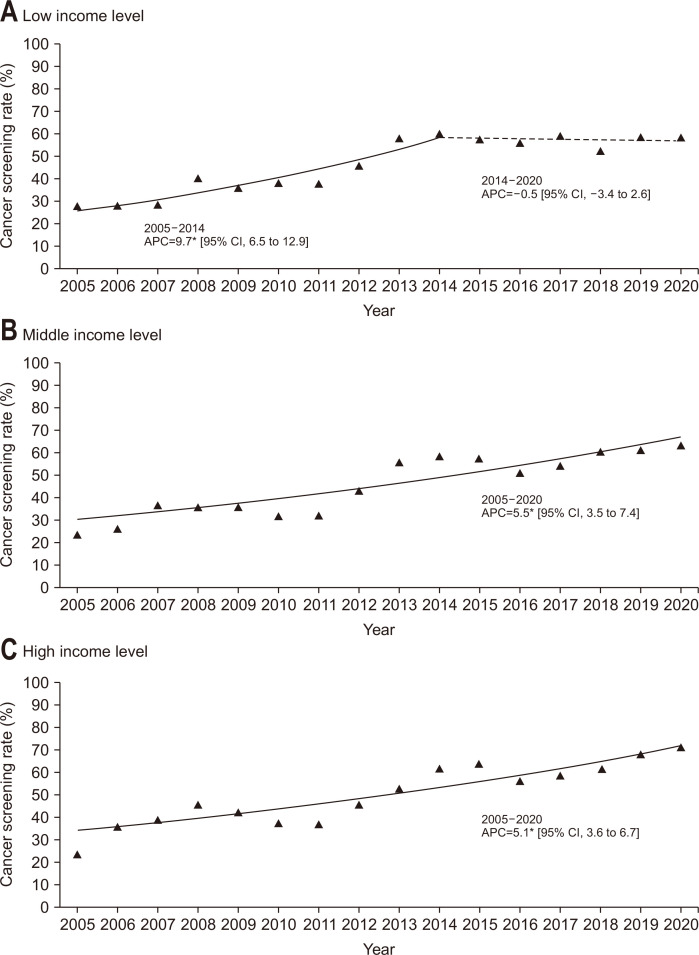
Fig. 3.
Trends of colorectal cancer screening rates by household income level, 2005–2020. Monthly household income status is classified by tertile. (A-C) The solid line denotes a significant increasing trend, while the dashed line denotes a non-significant change.
CI, confidence interval. *p-value for the trend of annual percent change (APC) <0.05.

