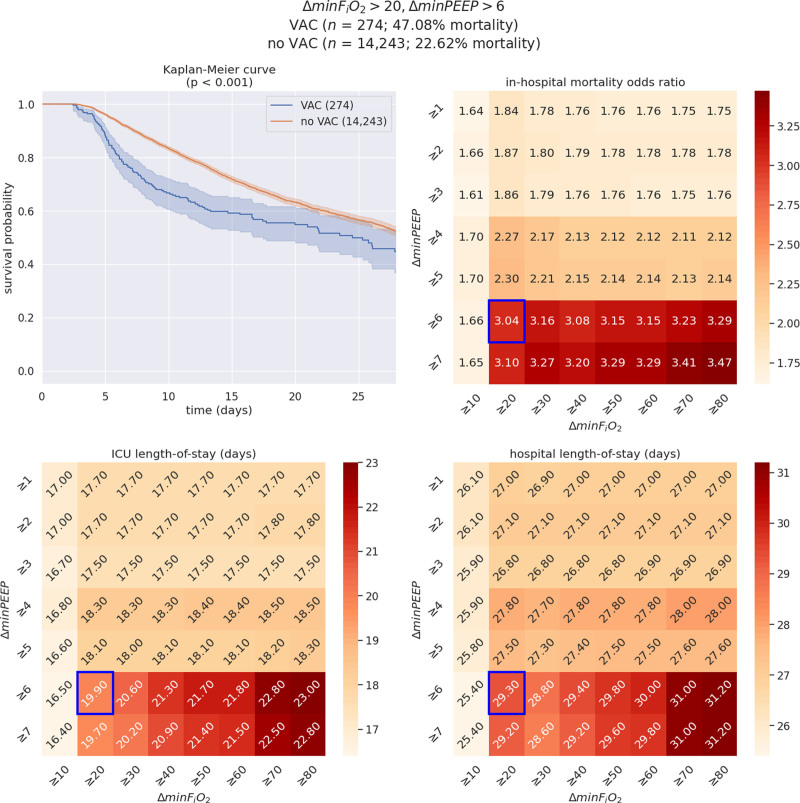
Figure 3.
Illustration of the interactive visualization tool for a select set of ventilation criteria: minimum Fio2 (ΔminFio2) greater than or equal to 20%, minimum positive end-expiratory pressure (ΔminPEEP) greater than or equal to 6 (n = 14,517; ventilator-associated condition [VAC] = 274; no ventilator-associated condition [VAC] = 14,243). On each heatmap, the cell surrounded by a blue box corresponds to the criteria selected in this example (ΔminFio2 ≥ 20, ΔminPEEP ≥ 6). Of note, the detrimental effects of VAC occurrence during the ICU stay are more pronounced than in the preceding example (ΔminFio2 ≥ 20, ΔminPEEP ≥ 3)—across all three outcomes. The upper left plot represents the Kaplan-Meier survival curves among patients with VAC versus patients without VAC (non-VAC) resulting from the selected set of clinical criteria, whereas the upper right heatmap illustrates variability in mortality odds ratios across changes in PEEP and Fio2. In addition, the lower panels showcase differences in ICU (left) and hospital (right) length of stay outcomes. Although the estimated Kaplan-Meier survival curve pertaining to VAC patients presents wider confidence intervals than in the first/previous/preceding example, the estimated probabilities of survival for VAC and non-VAC patients clearly separate until the end of follow-up (i.e. 28 d, p < 0.001).

