
FIG 2.
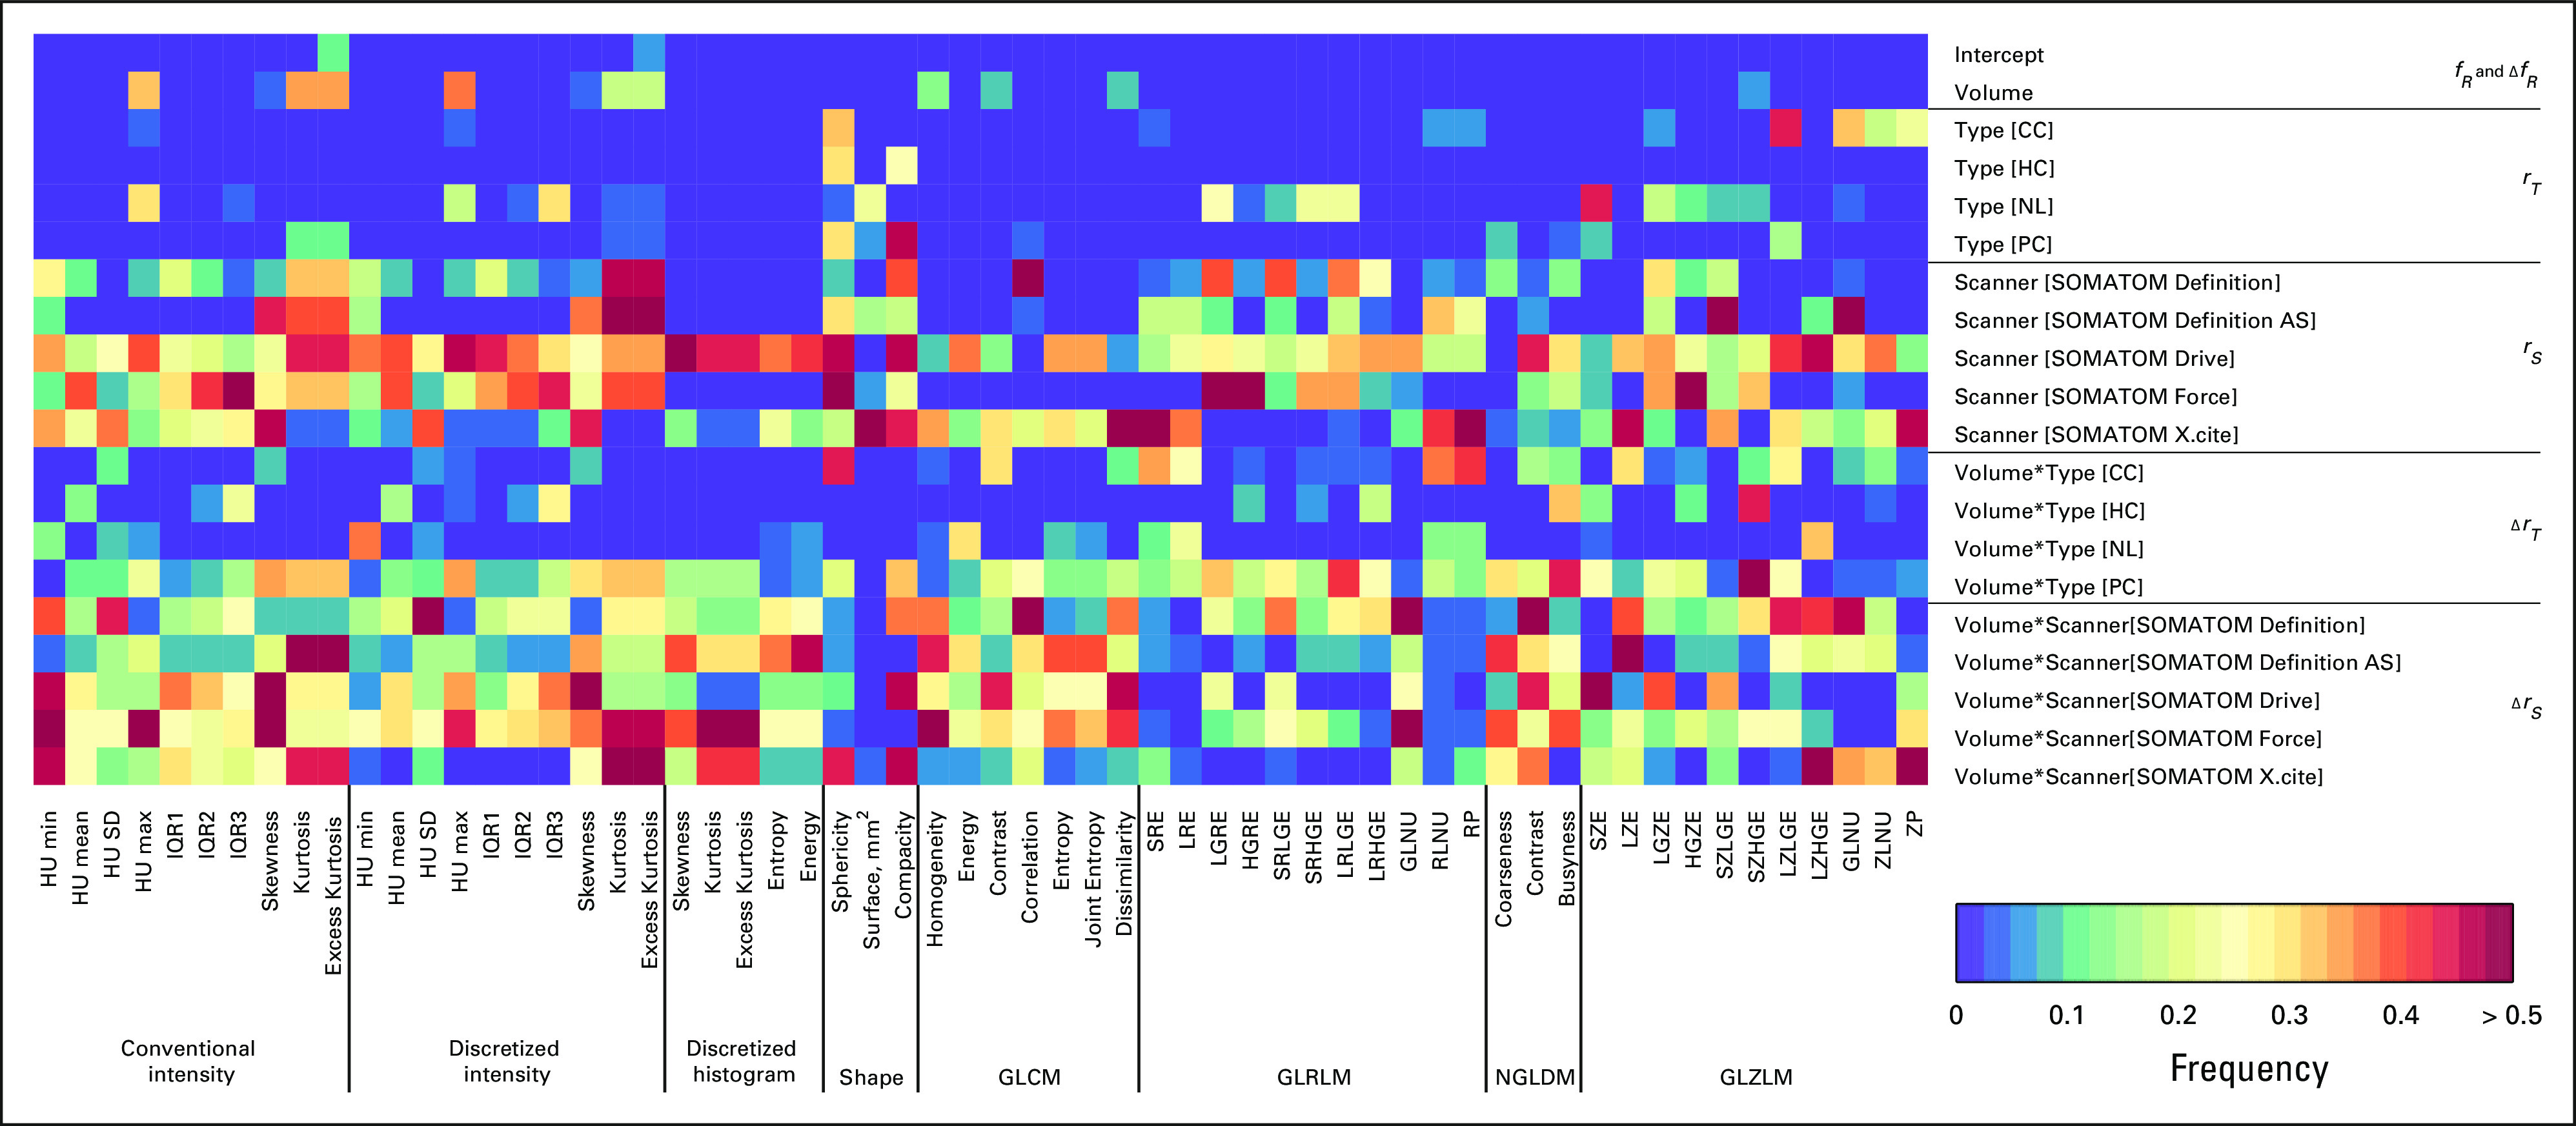
Heat map representing color-coded statistical significance of fixed and random effects in LME analysis. Rows correspond to individual components of fixed or random effects. Columns correspond to individual radiomic features. CC, colon cancer; GLCM, gray-level co-occurrence matrix; GLRLM, gray-level run length matrix; GLZLM, gray-level zone length matrix; HC, hepatic cysts; HU, Hounsfield Unit; IQR, interquartile range; LME, linear mixed-effects; NGLDM, neighborhood gray-level different matrix; NL, normal liver; PC, pancreatic cancer.