
FIG 3.
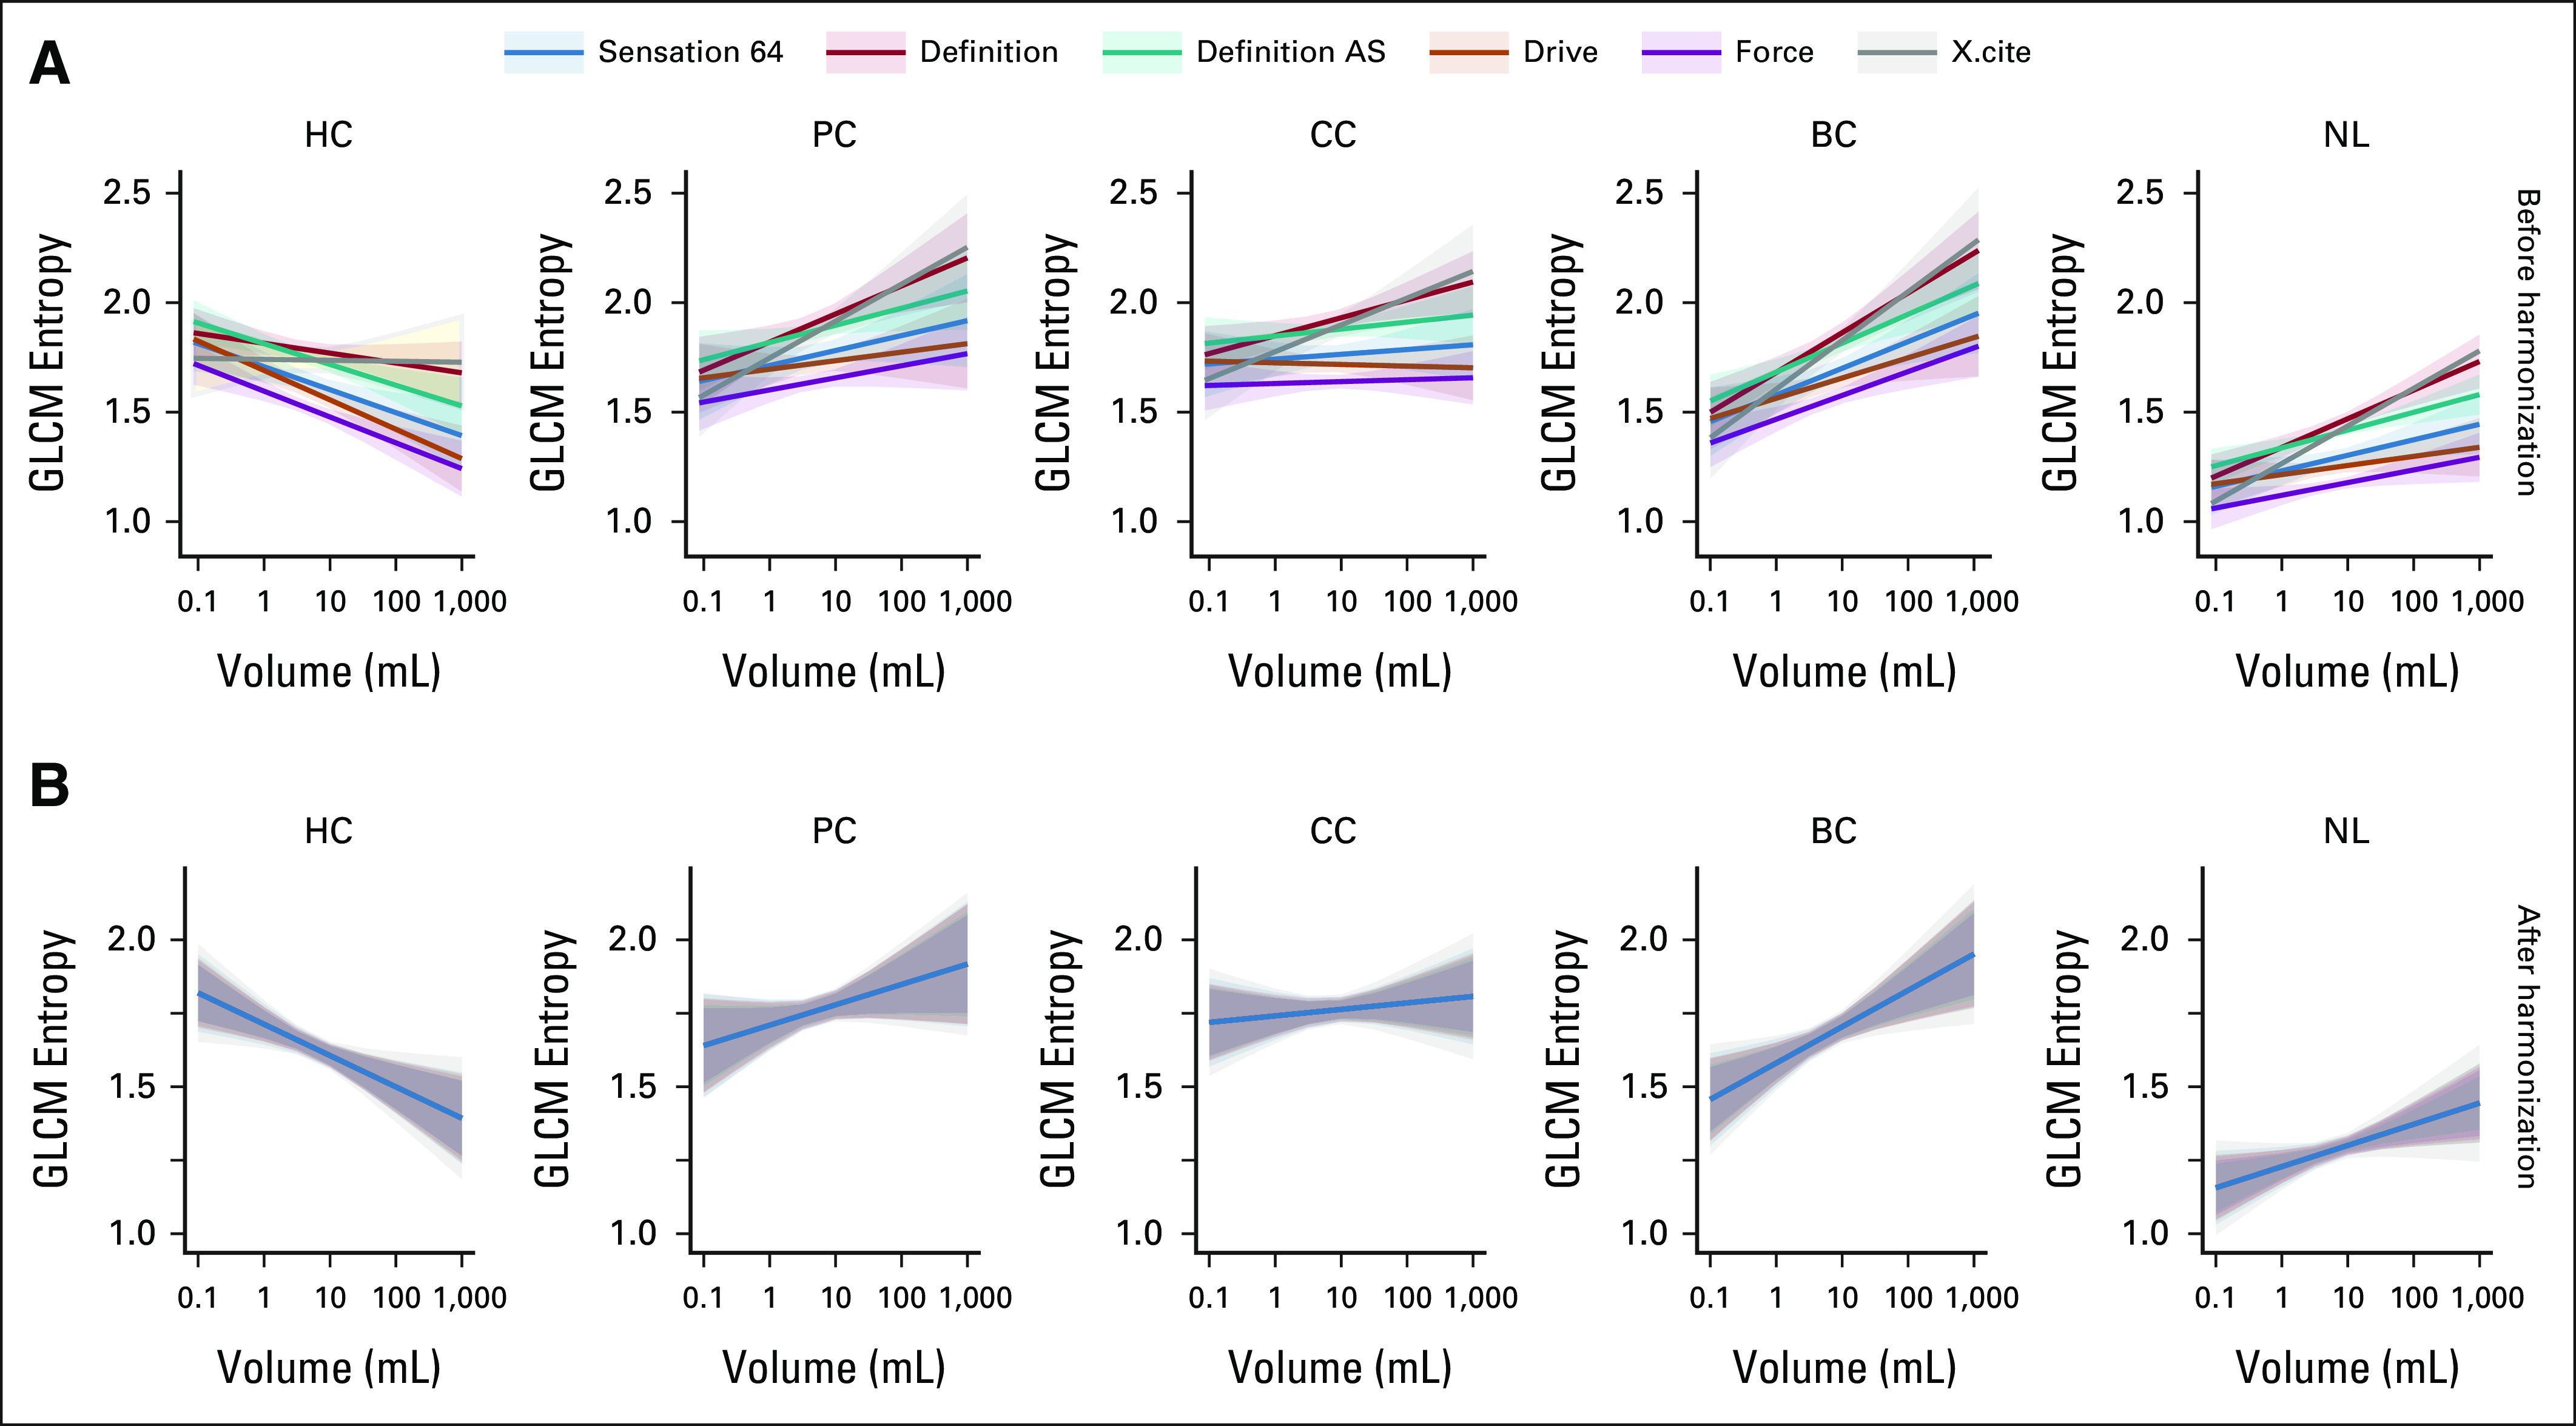
Graphical representation of LME regression analysis for GLCM entropy. Solid lines and shaded 95% CI areas are shown for each type of scanner and are colored differently. (A) and (B) The results for each type of liver lesion are combined in columns. The esults from nonharmonized and harmonized data sets are shown in rows. BC, breast cancer; CC, colon cancer; GLCM, gray level co-occurrence matrix; HC, hepatic cyst; LME, linear mixed-effects; NL, normal liver; PC, pancreatic cancer.