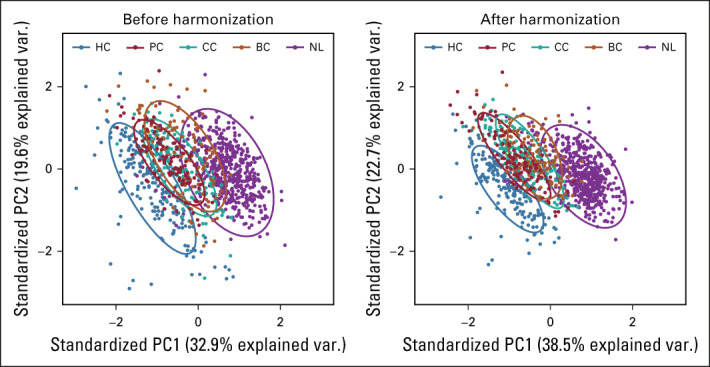
FIG A2.

PCA and summary distribution in metastatic liver disease scatter plots of top two principal components of the radiomic features across the two labels (clusters) using untransformed data or data transformed. BC, breast cancer; CC, colon cancer; HC, hepatic cysts; NL, normal liver; PC, pancreatic cancer; PCA, principal component analysis.
