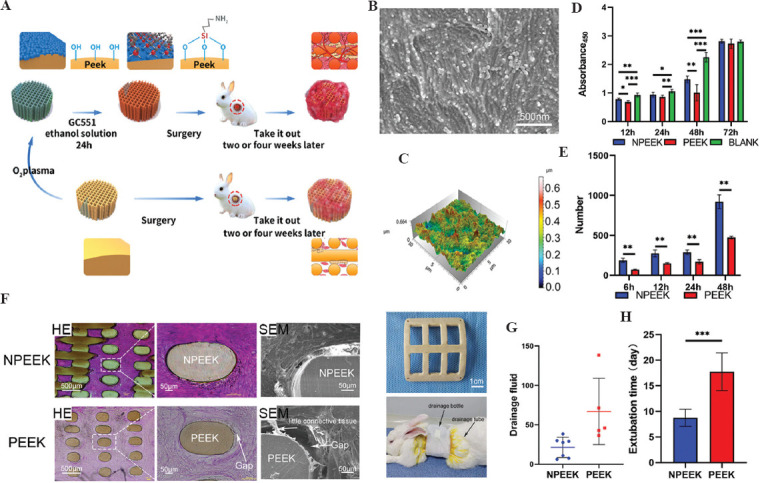
Figure 10.

Schematic diagram of FDM PEEK implant modification and animal experiment results (A); SEM images of the interface on amidogen PEEK (B); three-dimensional images of the interface on amidogen PEEK (C); the comparison of cellular proliferation in FDM PEEK, NPEEK scaffolds, and blank materials using CCK-8 method (D); the comparison of cell migration on NPEEK and PEEK interfaces using wound healing assay (E); HE staining and SEM images of soft-tissue ingrowth into the FDM PEEK and NPEEK scaffolds in vivo for 2 weeks (F); the clathrate PEEK or NPEEK implants and the rabbit after chest wall reconstruction surgery (G); the comparison of drainage fluid (H) and extubation time (I) after chest wall reconstruction surgery in FDM PEEK and NPEEK groups (*P < 0.05, **P < 0.01 and ***P < 0.001)[46].
