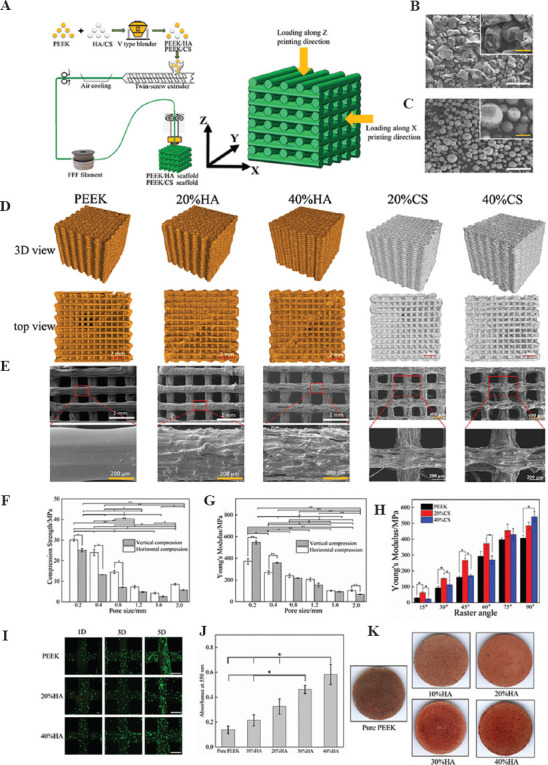
Figure 11.

Schematic diagram of the preparation processes of PEEK/additives composites and FDM technology (A); the SEM images of PEEK granular material (B) and HA powders material (C) (white bar, 100 mm; yellow bar, 50 mm); geometry images of PEEK/HA and PEEK/CS scaffolds under micro-CT (D); SEM images of PEEK/HA and PEEK/CS scaffolds (E); the comparison of compressive modulus (F) and compressive strength (G) in PEEK/HA scaffolds with different pore sizes; the comparison of compressive modulus of the PEEK/CS scaffolds with different CS content and raster angles (H); the comparison of cellular proliferation in PEEK/HA scaffolds with different HA content (white bar, 400 mm); the comparison of alizarin red staining (J) and Alizarin red staining (K) of MC3T3-E1cells on the PEEK/HA scaffolds with different HA content[47-49].
