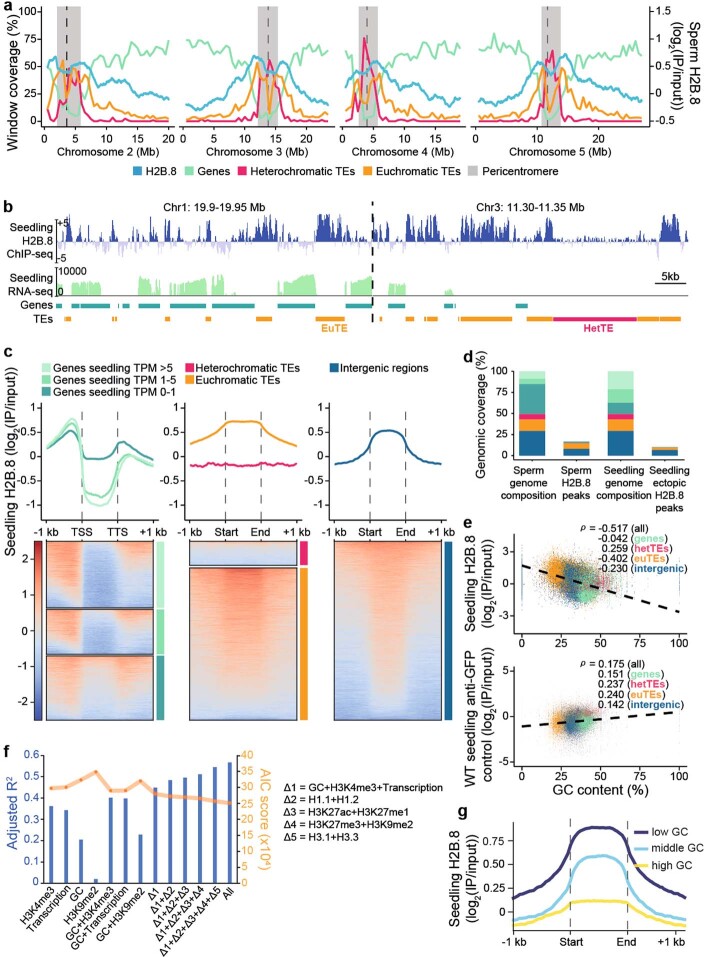
Extended Data Fig. 4. Ectopically expressed H2B.8 in seedlings exhibits a similar deposition profile as native H2B.8 in sperm.
a, Coverage of genes, euchromatic TEs and heterochromatic TEs (left Y axis; 500 kb windows) and H2B.8 enrichment in sperm (right Y axis; 1 kb windows) along Chromosomes 2 to 5. Chromosome 1 is shown in Fig. 4d. b, Genome snapshots of H2B.8 abundance (log2(IP/input)) and transcription (log2(RPKM)) in p35S::H2B.8-eGFP seedlings, and gene and TE annotations (orange, euchromatic TE; magenta, heterochromatic TE) over representative regions. RPKM, Reads Per Kilobase of transcript per Million mapped reads. c, Profiles and associated heatmaps of H2B.8 enrichment in p35S::H2B.8-eGFP seedlings over genes (grouped by seedling expression), TEs (grouped by chromatin state) and intergenic regions. d, Proportions (%) of the genome covered by genes, TEs and intergenic regions in wild-type sperm and seedling, and by respective H2B.8 peaks in pH2B.8::H2B.8-eGFP h2b.8 sperm and p35S::H2B.8-eGFP seedling. Same color coding is used as in (c) and Fig. 4b. e, Upper panel, scatterplot showing anticorrelation of H2B.8 enrichment with GC content (%) in p35S::H2B.8-eGFP seedlings over denoted genomic features. Lower panel, scatterplot showing the WT seedling anti-GFP enrichment (log2(IP/input)) control against GC content (%). ρ, Spearman’s Rank. f, Prediction of H2B.8 using indicated chromatin features, transcription (log10(RPKM+1)) and GC content as predictors. The y-axis shows the adjusted R2 value between the predicted and observed values. g, Profiles of H2B.8 enrichment in p35S::H2B.8-eGFP seedlings over non-genic (TE and intergenic) regions. The test regions were grouped into three equal parts by GC content levels (low GC < 0.29; 0.29 < middle GC < 0.34; high GC > 0.34).

