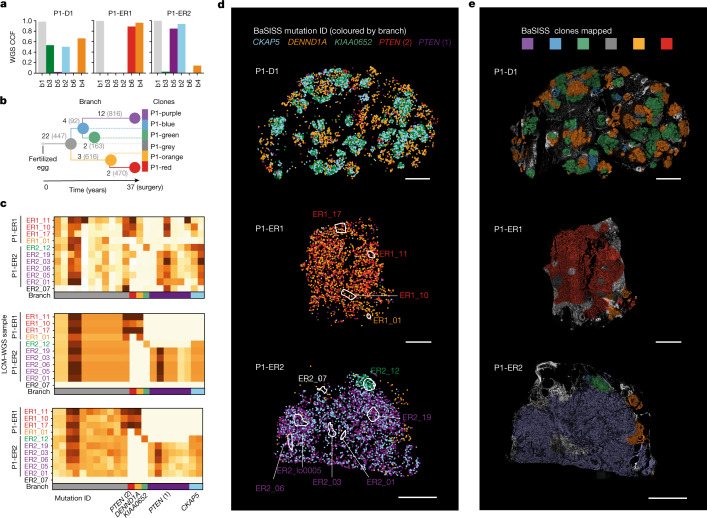
Fig. 2. Converting BaSISS spatial signals into maps of clones.
a, Bar plots of cancer cell fractions (CCFs) derived from bulk WGS of the P1 samples. b, Phylogenetic tree reconstructed from multiregional bulk WGS data from P1 (see Supplementary Methods for details). Each branch is labelled with the total number of WGS mutations defining the branch (grey text) and the number of BaSISS probes designed to target that branch (black text). c, Three heatmaps of variant allele fractions (VAFs) calculated using data derived from n = 11 regions of P1-ER1 and P1-ER2 (marked in d). Raw BaSISS VAFs (for each target mutation the number of mutant signals divided by total number of mutant plus wild-type signals) (top) and model-imputed BaSISS VAFs (middle) are derived from raw BaSISS signal data within these regions. In serial tissue cryosections, corresponding z-stack regions were identified and subjected to LCM–WGS. Resulting LCM–WGS VAFs are presented (bottom). Mean per-gene correlations are approximately 0.41 and 0.90 for BaSISS to LCM–WGS and model-imputed VAFs to LCM–WGS comparisons, respectively. Sample names are coloured according to the dominant BaSISS subclone in the sampled region. Each row represents a targeted mutation. The mutations plotted in d are labelled by their gene name; for PTEN there are two separate mutations. d, Spatial BaSISS detections of barcodes reporting on five selected mutations, coloured according to their targeted branch. White contours indicate LCM regions (relates to c). e, BaSISS clone maps in physical space projected on the DAPI image (nuclei are white), derived using BaSISS mathematical modelling of signals from 45 informative targets. Each clone has a different colour, and dominant clones are reported (shown if the CCF is more than 25% and the inferred local cell density is more than 300 cells per mm2). Scale bars, 2.5 mm (d,e).

