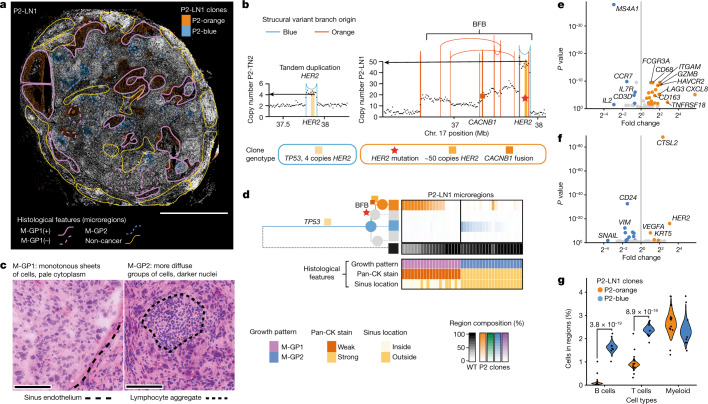
Fig. 5. Intrinsic and extrinsic features of metastatic subclones in a lymph node.
a, BaSISS map of P2-LN1, which relates to P2-TN1 (Fig. 3e) and P2-TN2 (Extended Data Fig. 6a,b). The most prevalent genetic clone colours are projected as coloured fields on the DAPI image (reported if the CCF is more than 25%; a threshold of 5% is used in regions of diffusely infiltrating blue to allow visualization in very high normal contamination regions). Scale bar, 2.5 mm. Coloured contours define microregions with distinct metastatic cancer growth patterns (M-GP1 and M-GP2); ‘+’ indicates the surrounding sinus epithelium. b, Plots of the genomic structures in P2-blue and P2-orange clones in the vicinity of the HER2 gene, derived from WGS data of P2-TN2 and P2-LN1. Vertical lines represent genomic rearrangement breakpoints coloured by the phylogenetic tree branch where the event occurred. Dots represent local (binned) copy number. HER2 amplification, CACNB1 fusion and HER2 mutation are BaSISS targets used to track this complex event. BFB, breakage fusion bridge. c, Representative areas of the two main growth patterns stained with H&E. Scale bar, 100 µm. d, Phylogenetic tree inferred from P2 multiregion WGS. Branch and node colours inform the clones mapped in a. The top heatmap reports the BaSISS clone contribution to 39 histologically annotated microregions from a (regions with 5% or more tumour cells are included); see https://www.cancerclonemaps.org/. The bottom heatmap reports microregion histological features. Pan-CK, pan-cytokeratin. e, Volcano plot of immune cell expression of the 62 genes in the ISS immune panel. f, Volcano plot of epithelial cell expression of the 91 genes in the ISS immune panel. Significantly (FDR > 0.1), differentially expressed (fold change of more than 1.5 both ways) genes are coloured. g, Violin plots depict clone-specific cell-type contribution posterior density of the generalized linear mixed model with region-specific random effect, and includes the 22 clone territories with a dominant clone fraction of more than 0.05 in P2-LN1. Significant comparisons were controlled for FDR using the Benjamini–Hochberg procedure.

