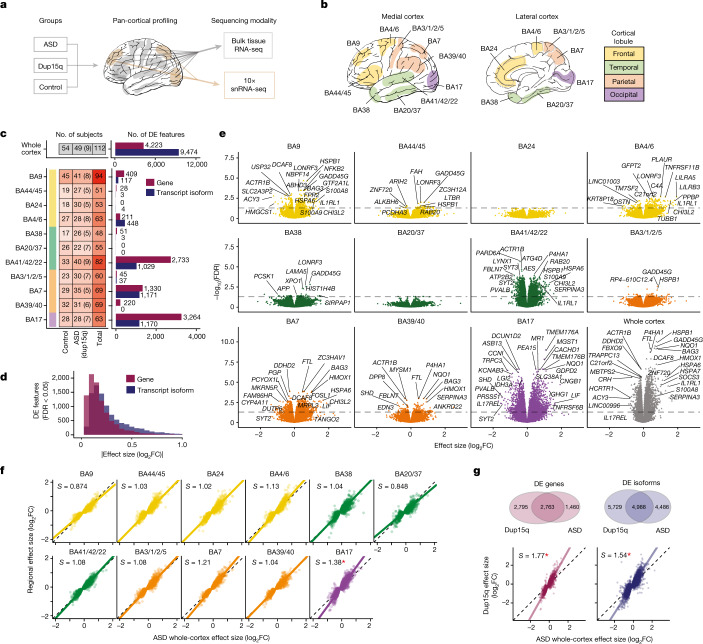
Fig. 1. ASD-associated transcriptomic differences across 11 cortical regions.
a, Study experimental design. Eleven regions were profiled by bulk RNA-seq, and three regions were also profiled by single-nucleus RNA sequencing (snRNA-seq) (Fig. 4). b, Human cortical Brodmann areas (BA) sequenced, with cortical lobules coloured consistently throughout this figure. c, The number of unique individuals by region and diagnosis (left), with the number of additional individuals with dup15q syndrome included in parentheses. Right, the number of differentially expressed (DE) (linear mixed model FDR < 0.05) features (genes and transcript isoforms) across the whole cortex (top) or within individual regions (below). d, Absolute value of effect-size changes are shown for differentially expressed genes and isoforms for whole-cortex analyses. Larger effect-size changes are observed at the transcript isoform level. e, Volcano plots show the top differentially expressed genes within regions and across the whole cortex. f, Differential expression effect size (log2FC) of individual regions compared with whole-cortex changes for the 4,223 cortex-wide differentially expressed genes. Slope (S) is calculated using principal components regression, with *P < 0.05 for S significantly different from unity by bootstrap (Methods). g, Top, Venn diagrams depicting the number of genes and isoforms that were differentially expressed across the whole cortex in dup15q samples compared with idiopathic ASD. Bottom, idiopathic ASD whole-cortex log2FC compared to the dup15q whole-cortex log2FC for the ASD whole-cortex differentially expressed genes (left) and isoforms (right). Slope is calculated using principal components regression.

