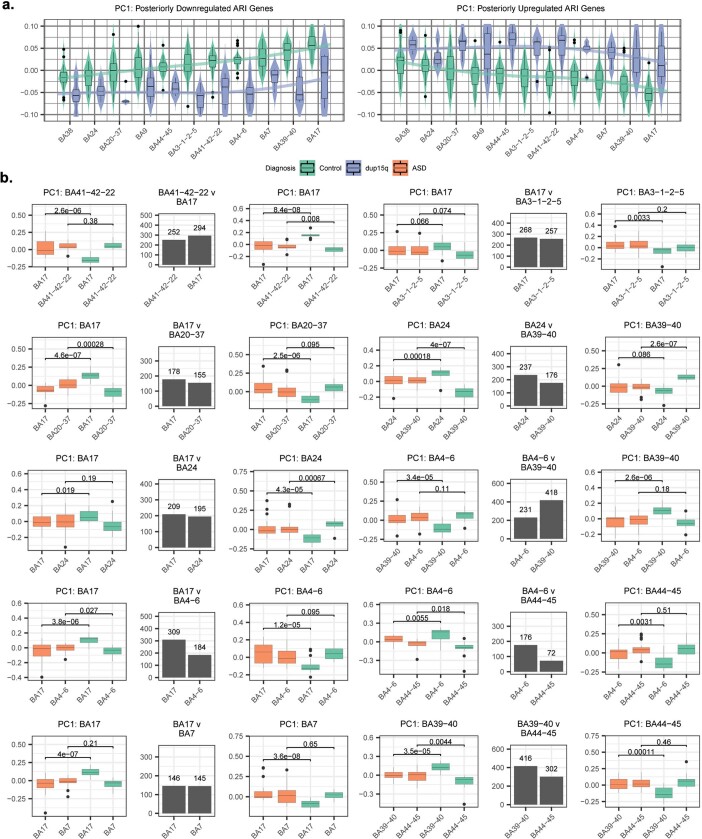
Extended Data Fig. 6. Additional ARI gene dysregulation.
a. First principal component (PC1) of ARI genes identified in ASD exhibiting posteriorly downregulated (n = 1,881 genes, left) or upregulated (n = 1,695 genes, right) patterns of expression. Boxplots show median and interquartile range (25th/75th percentile; bounds of box) +/− 1.5 times the interquartile range (whiskers) for PC1 of these genes for each regional comparison, summarized across controls and dup15q samples (loess regression line plotted). The unique number of subjects per region is indicated in Fig.1. b. For each significantly attenuated regional comparison, the identified attenuated regional identity (ARI) genes. At center, number of ARI genes with greater neurotypical expression in each pair of regions. On either side of the barplot, the PC1 of the genes with greater neurotypical anterior (left) or posterior (right) expression is plotted across the pair of regions in Controls and ASD. The Wilcoxon signed-rank test (unpaired; two-tailed) p-value is shown. Boxplots show median and interquartile range (25th/75th percentile; bounds of box) +/− 1.5 times the interquartile range (whiskers) for PC1 of the genes for each regional comparison, summarized across controls and ASD samples, with the unique number of subjects per group x region comparison indicated in Fig. 1b.

