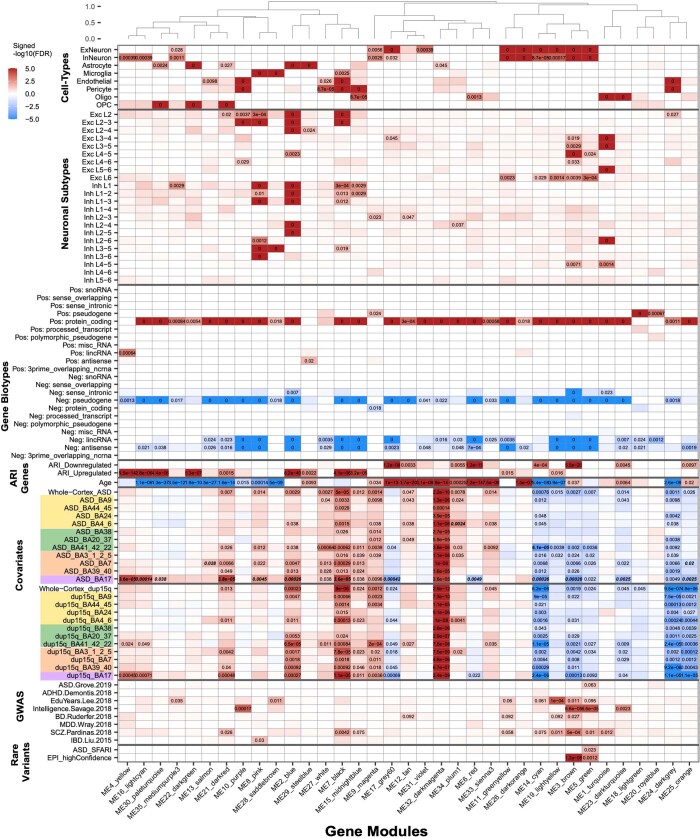
Extended Data Fig. 7. Gene-level Co-Expression Network Analysis Module Associations.
Top: average-linkage hierarchical clustering of module eigengene biweight midcorrelations. Significant FDR corrected p-values (two sided) are indicated (FDR < 0.05; for GWAS, FDR < 0.1). For ASD, dup15q, and age covariates, FDR-corrected p-value (two sided) from the linear mixed model testing the association of these covariates with module eigengenes is depicted. For the ASD and dup15q region-specific comparisons, cortical lobule colours are indicated (Fig. 1), and bold-italic FDR-corrected p-values indicate that these regions are affected with significantly greater magnitude than the ASD whole-cortex (Methods). For gene biotypes, both positive and negative enrichment is shown (Fisher’s exact test; Methods). Positive enrichment is shown for cell-type, neuronal subtype (ref. 23), ARI gene, GWAS, and rare variant enrichment (Methods).

