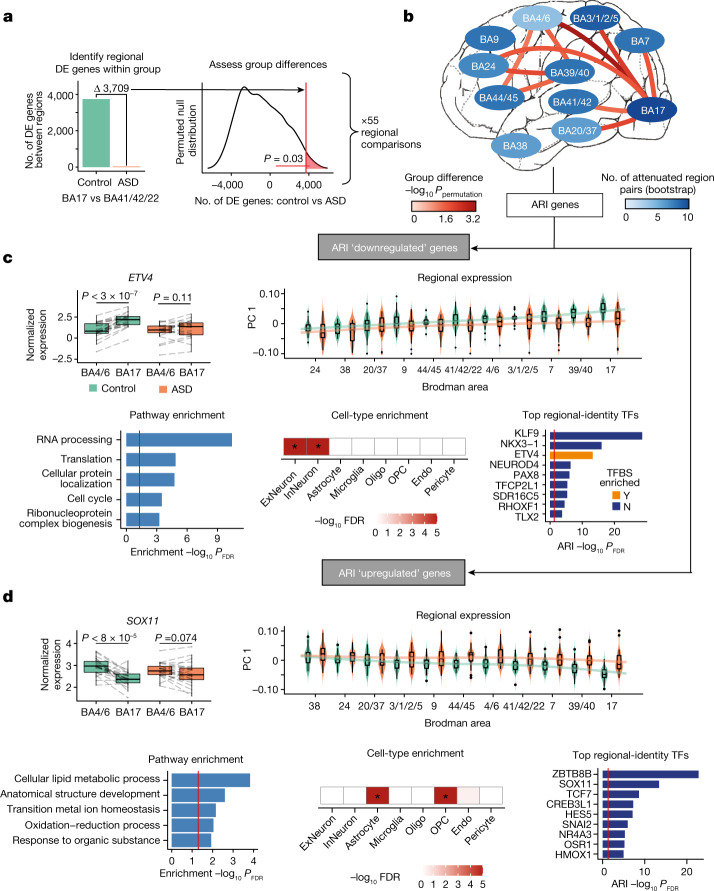
Fig. 2. Cortex-wide transcriptomic regional-identity attenuation in ASD.
a, Overview of methods for identifying statistically significant differences in transcriptomic regional identity in ASD. The regional comparison of BA17 versus BA41/42/22 is used here as an example. Left, the number of differentially expressed genes between regions is calculated in controls and ASD samples. Right, a permuted null distribution is then used to determine the significance of the difference in differentially expressed genes between controls and ASD samples. b, Regional comparisons of ARI in ASD, with those comparisons reaching a permutation P < 0.05 connected with a line (red scale). Cortex-wide attenuation identified with a bootstrap approach (Methods) is summarized by region colour (blue scale; 0, no pairs exhibiting attenuation in ASD; 10, all pairs exhibit attenuation in ASD). For region colour, a regional pair is considered attenuated if it contains less differential expression in ASD compared with controls. ARI genes are extracted from regional comparisons with permutation P < 0.05 (Methods). c,d, Overview of downregulated (c) and upregulated (d) ARI genes. Top left, attenuated transcription factors (TFs) in BA17 and BA4/6. Lines link paired samples from the same individual, and the paired Wilcoxon signed-rank test P-value is plotted above the box plots. Top right, principal component 1 (PC 1) of ARI genes across all regions; regions are ordered by the control median. Bottom left and bottom centre, gene ontology and cell-type enrichment (*FDR < 0.05), respectively. Bottom right, top 10 attenuated transcription factors; FDR is representative of how well these transcription factors distinguish BA17 and BA39/40 from the remaining nine other cortical regions in controls (Methods). Enrichment for transcription factor binding sites is also depicted (Bonferroni-corrected P-value < 0.05 is required for enrichment). ExNeuron, excitatory neuron; InNeuron, inhibitory neuron; oligo, oligodendrocyte; OPC, oligodendrocyte precursor cell; endo, endothelial cell.

