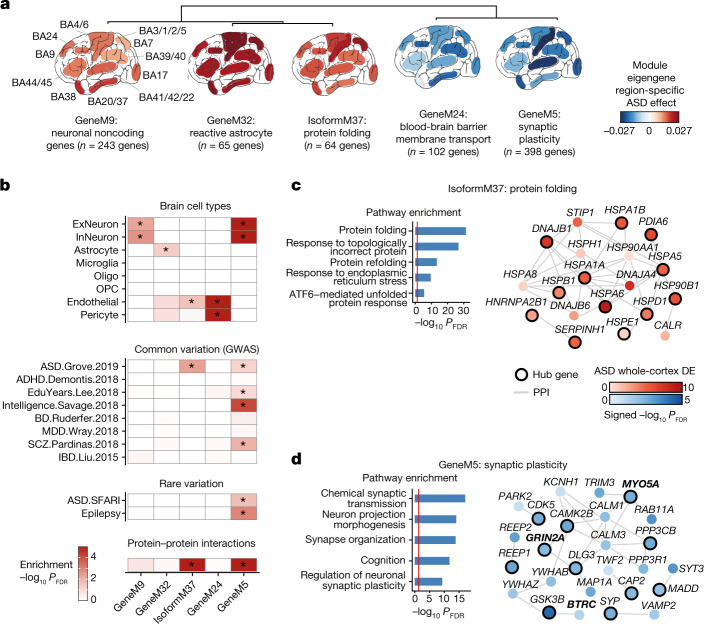
Fig. 3. Co-expression network analysis characterizes cortex-wide dysregulation of ASD risk genes.
a, Hierarchical clustering of the top 5 most dysregulated gene and isoform co-expression module eigengenes (first principal component of the module) with regionally consistent patterns of ASD dysregulation. The module eigengene ASD effect is indicated for each cortical region examined (Methods). n indicates the number of genes or isoforms in each module. b, −log10(FDR) for cell-type, genome-wide association study (GWAS), rare-variant and protein–protein interaction enrichment for the modules depicted in a. GWAS references (left margin): ASD.Grove.2019, ref. 21;ADHD.Demontis.2018, ref. 39; EduYears.Lee.2018, ref. 40; Intelligence.Savage.2018, ref. 41; BD.Ruderfer.2018, ref. 42; MDD.Wray.2018, ref. 43; SCZ.Pardinas.2018, ref. 44; IBD.Liu.2015, ref. 45. *Significant enrichment (FDR < 0.05 for cell-type, rare-variant and protein–protein interaction enrichment, and FDR < 0.1 for GWAS enrichment). c,d, For ASD GWAS-enriched modules, IsoformM37 (c) and GeneM5 (d), top gene ontology terms (left) and hub genes (module genes within the top 20 genes with the highest correlation with the module’s eigengene) whose gene products participate in a protein–protein interaction with those of any other module gene are depicted along with their PPI partners (right). Node colour is the signed –log10(FDR) of the whole-cortex ASD effect, edges denote direct PPIs, and hub genes are indicated with a black outline. SFARI database22 gene symbols are in bold.

