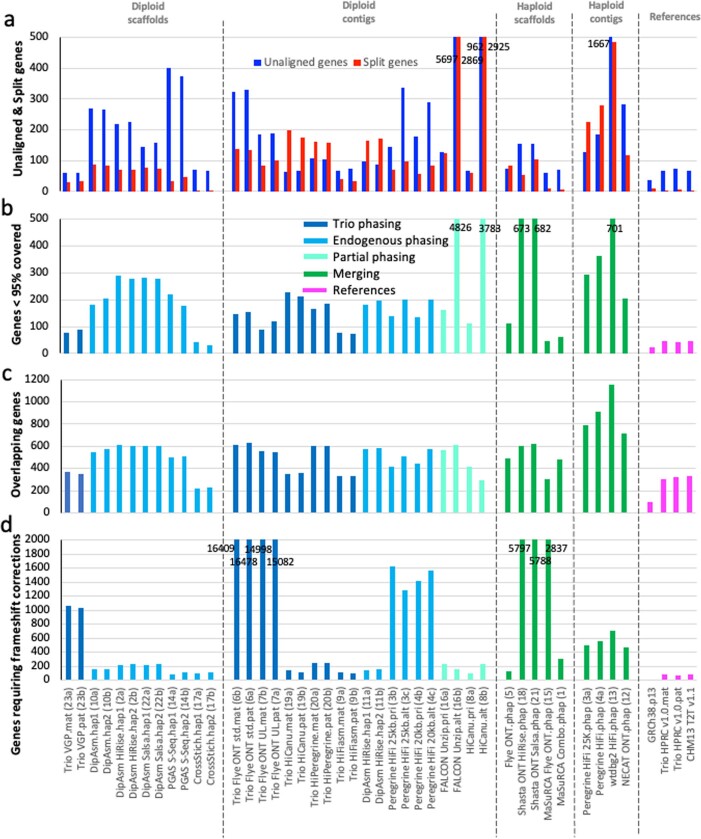
Extended Data Fig. 7. Annotation benchmarking.
a, Side-by-side comparisons of gene transcripts that did not align to each assembly (blue) versus those that were split between two or more scaffolds/contigs (red). b, Number of genes that had less than 95% the length covered in the assembly. c, Genes in the assemblies with overlapping transcripts due to possible collapse in the assemblies. d, Genes requiring frameshift corrections to make a complete protein. Values written in the graphs are for those off the chart, in order to not mask the lower values of most other assemblies.

