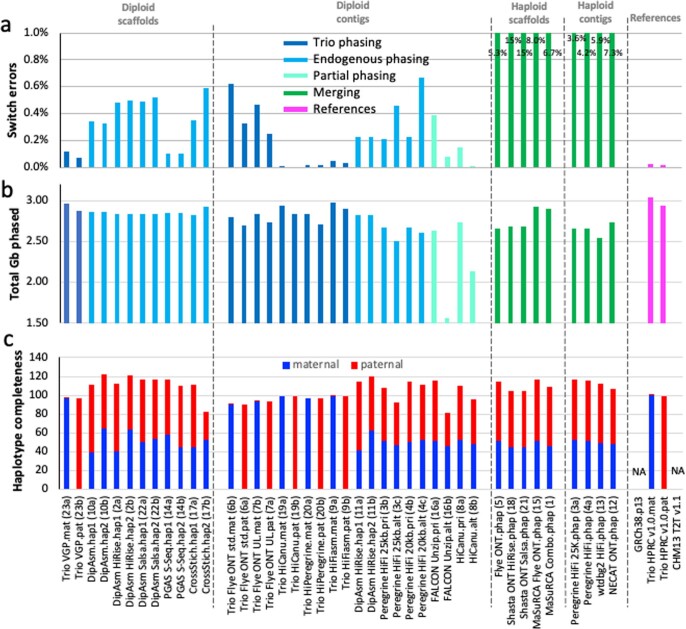
Extended Data Fig. 8. Haplotype phasing metrics.
a, Haplotype switch errors within scaffolds and/or contigs of each assembly (lower % is more accurate). Values written in the graphs for the haploid assemblies (greens) are off the chart, in order to not mask the lower switch error values of most other assemblies. b, Total Gb of each assembly that has been haplotype phased (~3.0 is the theoretical maximum of the maternal haplotype; 2.9 for the paternal). c, Haplotype phasing completeness according to parental k-mer statistics for each assembly. A complete phased assembly will have both maternal (blue) and paternal (red) each at 100% without mixture from the other. The trio approaches had nearly full phase separation, whereas the non-trio approaches nearly had half and half separation because there was not an attempt to phase across contigs or scaffolds/chromosomes belonging to the same maternal or paternal haplotypes. Combined values over 100% indicate a mixture of haplotype presumably due to false duplications; although values under 100% could still have false duplications.

