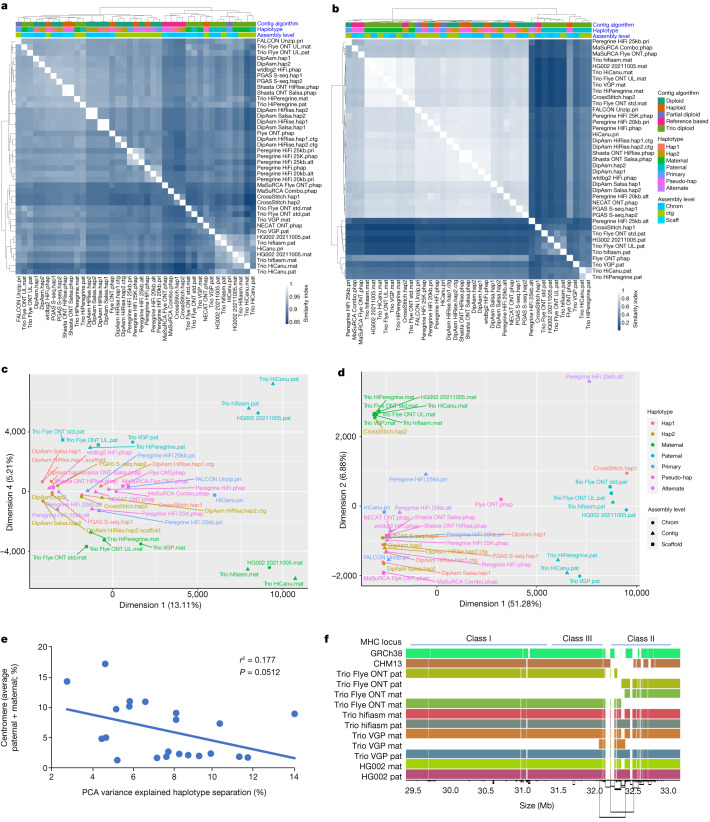
Fig. 2. Multidimensional relationship among assemblies.
a,b, Clustering of pairwise Jaccard similarities between pairs of assemblies, for the autosomes 1–22 (a) and the X and Y sex chromosomes (b). In the heatmap, the lighter the blue (Jaccard similarity index closer to 1), the more similar the assemblies (1 indicates identical assemblies). Assemblies are annotated with four different colour-coded classifications. c,d, PCA on the multidimensional Euclidean distances among assemblies, for the autosomes 1–22 (c) and the X and Y sex chromosomes (d). PCA dimensions shown are those in which the paternal and maternal haplotypes separated the strongest. e, Correlation between centromere size relative to chromosome size (%) and PCA variance (%) in the dimension where the Trio-based autosome assemblies separated by haplotype. f, Graph-based alignment of a 5-Mb region of human chromosome 6 containing the MHC locus of the Trio-based assemblies and GRCh38 and CHM13 references. Each colour is a different assembled haplotype. The Trio hifiasm assembly and the final HG002 assembly that used Trio hifiasm assembled the entire MHC locus in one single contig.

