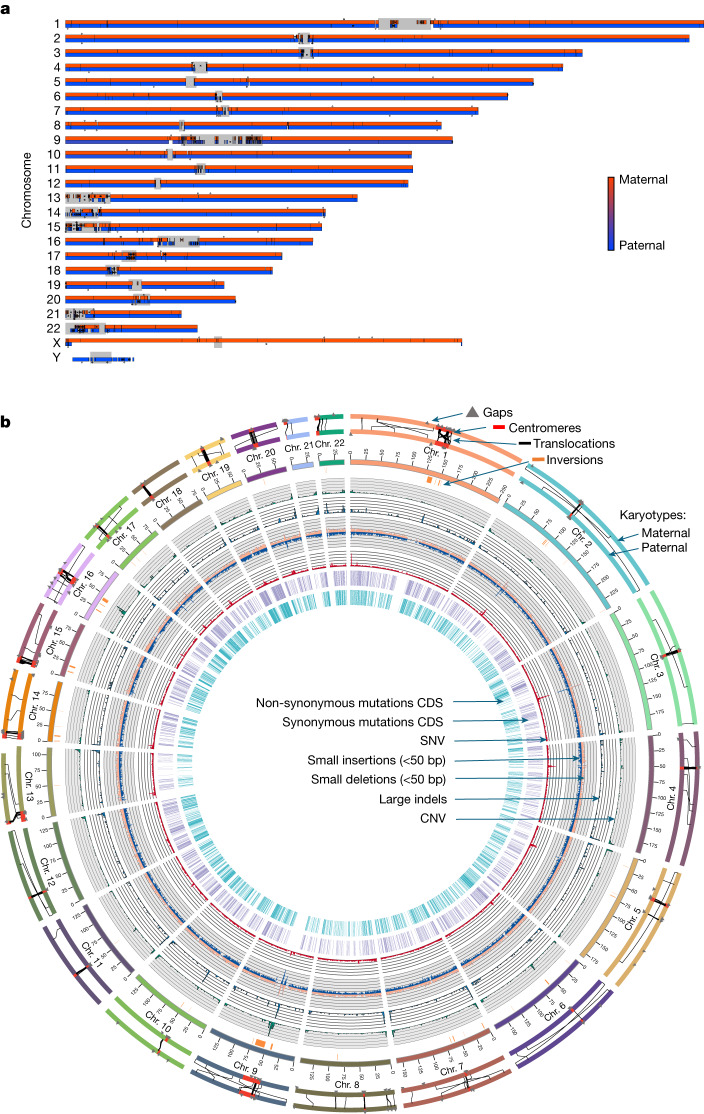
Fig. 4. HPRC-HG002 features.
a, Chromosome alignments between HPRC-HG002 maternal (top) and paternal (bottom) assemblies and CHM13 and the Y chromosome of GRCh38. Haplotype separation is nearly complete, and thus colours are solid blue (paternal) and red (maternal). Colour values were determined by the number of aligned haplotype-specific k-mers. A few ambiguous alignment blocks (purple) are highly repetitive regions, where it is hard to extract enough haplotype-specific k-mers. The black tick marks indicate gaps between contigs. Unaligned regions, which are mostly centromeric satellites, are shown in grey. b, Circos plot of the heterozygosity landscape between the two HG002 haploid assemblies. Tracks from inside out: synonymous amino acid changes; non-synonymous changes; SNV density (window size of 500 kb, range of 0–3.1%), and small deletion and small insertion (less than 50 bp) density (window size of 1 Mb, range of 0–850); large indel density (50 bp or more, window size of 1 Mb, count of 0–20) and copy number variant (CNV) density (window size of 1 Mb, count of 0–77). The black line links in the outermost circles denote intrachromosomal translocations (50 bp or more) between paternal (inner) and maternal (outer) assemblies. The orange bars indicate inversions (50 bp or more), the red bars denote centromeres and the grey triangles indicate gaps. CDS, coding sequence.

