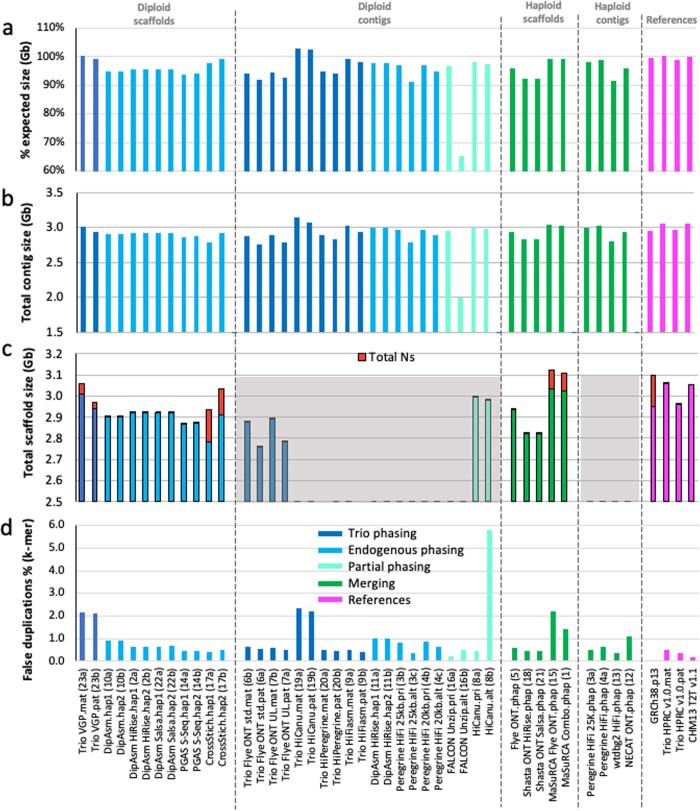
Extended Data Fig. 2. Assembly size and false duplication metrics.
a, Percent assembly sizes of expected maternal with Chr X (3,054,832,041 bp) or paternal with Y (2,995,432,041 bp) for trio-based assemblies, or simply relative to maternal size for all other assemblies. b, Total summed length of all contigs. c, Total summed length of scaffolds, with proportion contributed by Ns (red) in gaps. d, estimated percent of assembly size that is due to false duplications based on k-mer values for each haplotype. Color coding and gray shaded regions are as described in Fig. 1.

