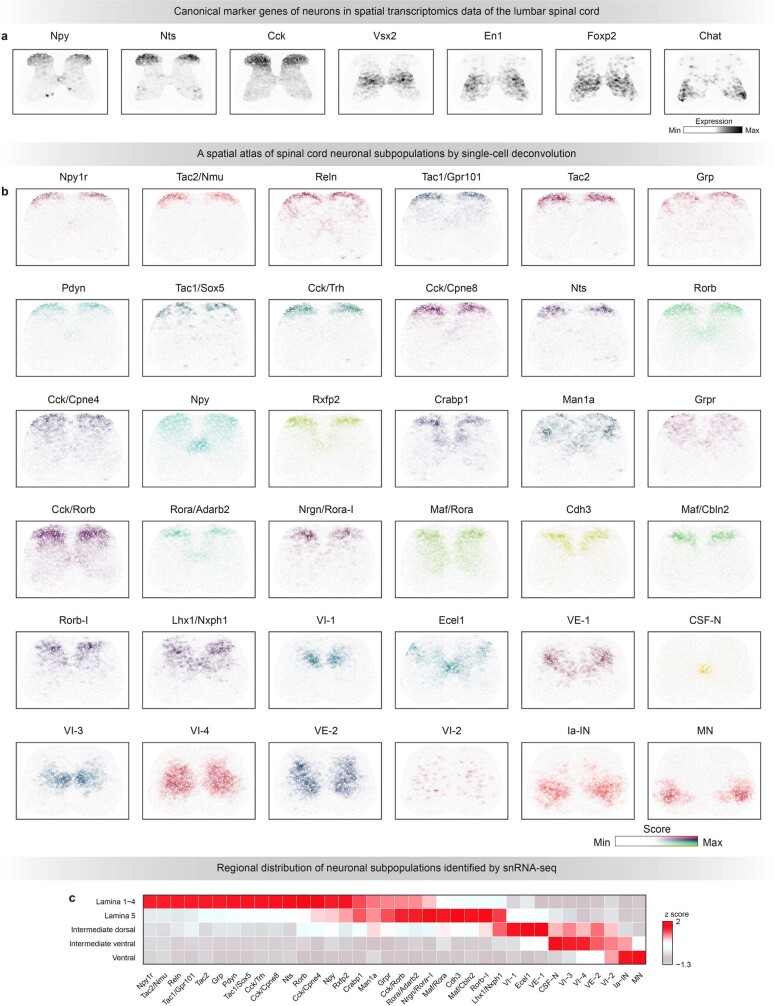
Extended Data Fig. 6. Integration of single-nucleus and spatial transcriptomes.
a, Spatial expression of key marker genes for canonical neuronal subpopulations of the mouse lumbar spinal cord. b, Deconvolution of spatial barcodes using snRNA-seq data to establish a spatial atlas of neuronal subpopulations. Panels show the score assigned by robust cell type decomposition (RCTD) to each of the 36 neuronal subpopulations for each barcode in the spatial transcriptomics dataset. c, Mean RCTD scores assigned for each of the 36 neuronal subpopulations to barcodes within five regions of the spinal cord.

