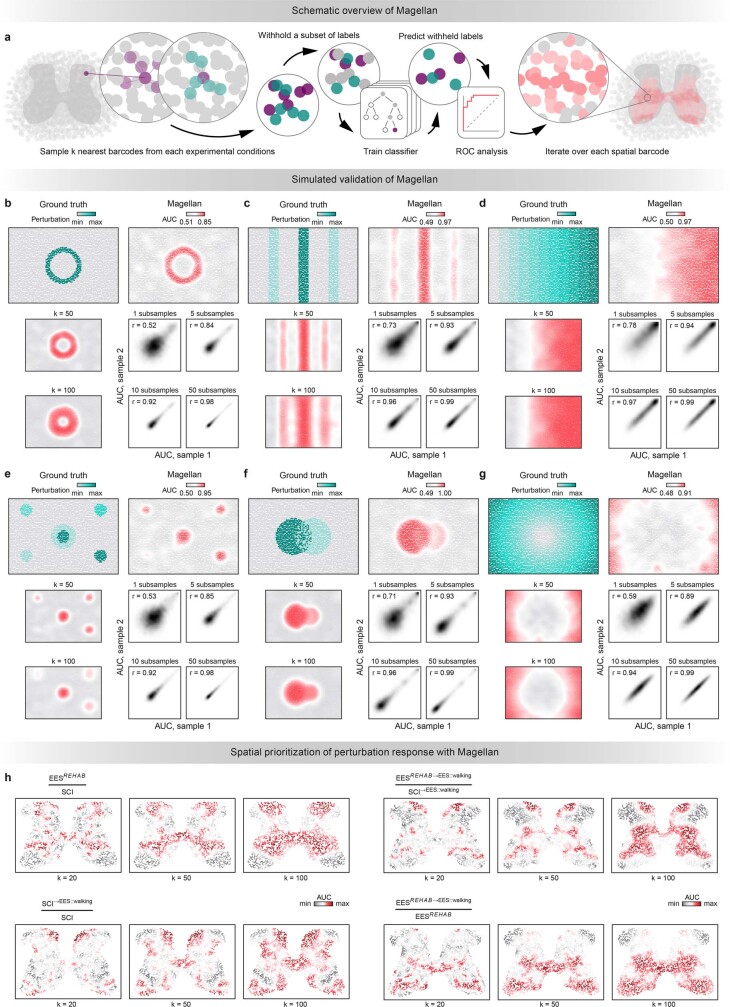
Extended Data Fig. 10. Spatial prioritization of perturbation responses with Magellan.
a, Schematic overview of Magellan. b–g, Validation of Magellan in simulated data. Six different patterns of perturbation were simulated. Perturbation patterns were selected in order to illustrate key desiderata for a robust spatial prioritization method, including the ability to detect sharp borders of perturbation-responsiveness, smooth gradients of perturbation-responsiveness, and multifaceted perturbation responses of differing intensities. Top left, the ground-truth pattern of perturbation responsiveness in simulated spatial transcriptomics data. Top right, spatial prioritizations assigned by Magellan, with default parameters. Bottom left, robustness of spatial prioritizations assigned by Magellan when varying the number of spatial nearest-neighbors, k, used to assign a perturbation score to each barcode (default, k = 20). The parameter k controls the spatial resolution at which Magellan circumscribes the perturbation response. Bottom right, reproducibility of perturbation scores when varying the number of times three-fold cross-validation is repeated for each barcode (default, 50 times). h, Robustness of spatial prioritization to the number of spatial nearest-neighbors, k, used to assign a perturbation score to each barcode, shown for four direct comparisons between two experimental conditions each capturing key therapeutic features of EESREHAB.

