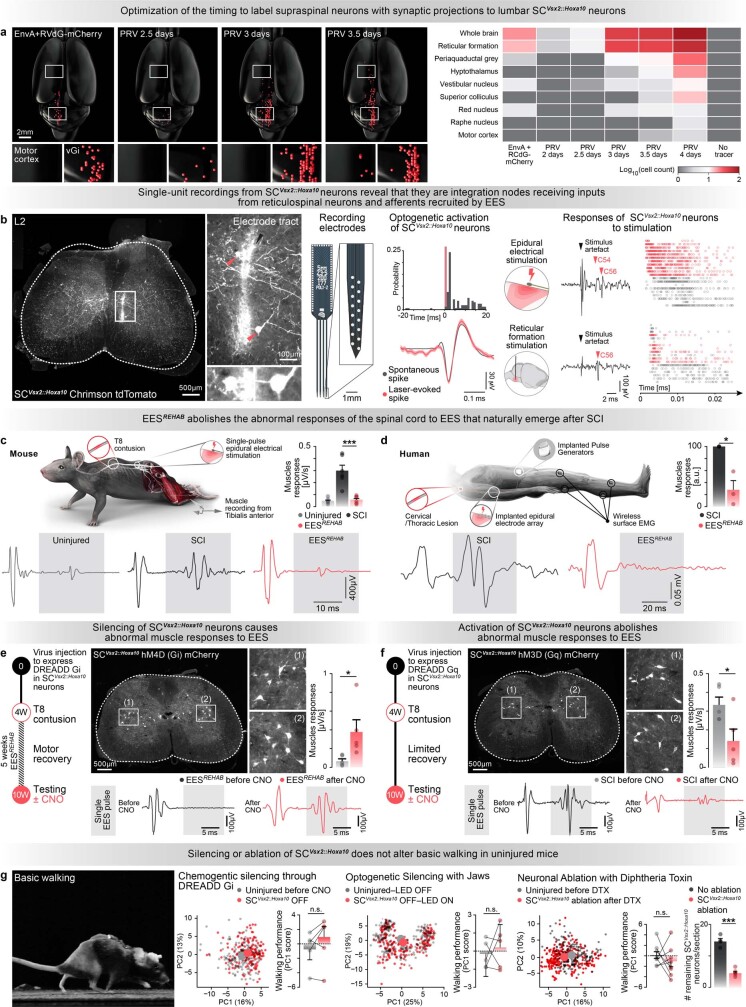
Extended Data Fig. 13. Anatomical and functional features of SCVsx2::Hoxa10 neurons.
a, Optimization of the timing to identify supraspinal neurons connected to SCVsx2::Hoxa10 neurons using rabies viruses. Tracing was conducted using infusions of Cre-dependent G-deleted EnvA rabies or Cre-dependent pseudorabies (PRV) into the lumbar spinal cord of Vsx2Cre mice. For pseudorabies experiments, tissue was harvested at 2, 2.5, 3, 3.5 and 4 days after the infusion. Sagittal brain sections were used for 3D reconstructions of brains in Neurolucida, shown here for key timepoints. Quantifications report the number of neurons identified in each region of the brain and brainstem after rabies infusion, and at different timepoints after pseudorabies infusions. At 3.5 days days after pseudorabies injections, neurons were labeled in new brain regions compared to regions labeled with monosynaptically-restricted rabies, suggesting that secondorder neurons became transfected by the pseudorabies. We thus used a window of 3 days to study the connectome of SCVsx2::Hoxa10 neurons after SCI. b, Transverse spinal cord section from a Vsx2Cre mouse showing Cre-dependent expression of ChrimsonR in SCVsx2::Hoxa10 and the tract resulting from the insertion of one electrode shank. Inset shows the cell bodies of SCVsx2::Hoxa10 neurons in the vicinity of the tract. The schematic displays the 4-shank, 64-channel silicon probe used for single-unit recordings. The histogram reports the timing of spikes with respect to the onset of photostimulation for the SCVsx2::Hoxa10 optotagged single unit shown in Fig. 3d. The waveforms display spontaneous (gray) vs. optogenetically-evoked (red) spikes from an SCVsx2::Hoxa10 optotagged single unit. Data are shown as mean traces with standard error of the mean ribbons. The traces on the right were obtained from the same recording site during EES (top) and stimulation of the reticular formation (bottom). In these trials, two single-units responded to EES, whereas only one of these two units also responded to stimulation of the reticular formation (C56). The plot on the right reports the latencies of spikes from SCVsx2::Hoxa10 optotagged single units following EES across all trials (150 trials, top) and stimulation of the reticular stimulation (100 trials, bottom). Neurons that consistently responded to stimulations with short latencies (putatively monosynaptic) are highlighted in red. c, To evaluate the response of the spinal cord to EES, we measured muscle responses in the tibialis anterior when delivering a single pulse of EES. We tested uninjured mice, mice with chronic SCI, and mice that had undergone EESREHAB. Mice with chronic SCI exhibited abnormal long-latency responses (range: 10 to 20 ms), which are highlighted within the grey area and quantified in the bar plots as integral of root mean square (RMS) (n = 6 mice per group; statistics indicate Tukey HSD tests of the key comparison following one-way ANOVA, P = 0.0001). d, The evaluations reported in c for mice were also conducted in the cohort of human participants. Three of the participants (DM002, GO004, HT008) showed abnormal long-latency responses (range: 50 to 100 ms) to single-pulse of EES before EESREHAB. EESREHAB nearly completely abolished these responses. The bar plot reports the normalised amplitude of these responses before and after EESREHAB (n = 3, trials > 5/session; mixed-effects model, t = –6.40, P = 2.9 × 10⁻⁸). e, f, The role of SCVsx2::Hoxa10 neurons in the reorganization of muscle responses to EES was evaluated using Cre-dependent expression of Gi, e, or Gq DREADDs in SCVsx2::Hoxa10 neurons, f. The timelines summarize the timing of the various experimental procedures. The photographs illustrate the expression of DREADD receptors in SCVsx2::Hoxa10 neurons. Long-latency muscle responses to single-pulse of EES were quantified before and 30 min after CNO injections that either silenced (Gi) or activated (Gq) SCVsx2::Hoxa10 neurons. Bar plots report the integral of the RMS of long-latency muscle responses for each each experimental condition (n = 5 mice per group (Gi); paired samples two-tailed t-test, t = 2.4, P = 0.046; n = 5 mice per group (Gq); paired samples two-tailed t-test, t = 2.8, P = 0.047). g, Three complementary strategies were used to evaluate the role of SCVsx2::Hoxa10 neurons during basic unskilled walking in uninjured mice: targeted injections of AAV5-flex-hm4di (Gi) or AAV5-flex-Jaws in the lumbar spinal cord of Vsx2Cre mice to evaluate the short-term or immediate impact of silencing SCVsx2::Hoxa10 neurons, and targeted injection of AAV-flex-DTR to evaluate the long-term impact of the complete ablation of SCVsx2::Hoxa10 neurons. Locomotor performance was evaluated during overground walking using the procedures detailed in Extended Data Fig. 2e (n > 20 gait cycles per mouse, n = 5 mice per group). The bar plot reports locomotor performance, quantified as average scores on PC1 (n = 5 mice per group except for DTR with n = 8 mice per group; paired samples two-tailed t-test, Gi: t = 1.4; P = 0.23; LED: t = 1.5, P = 0.21; DTR: t = 1.1, P = 0.33), and the number of SCVsx2::Hoxa10 neurons per tissue section (SCVsx2::Hoxa10 ablation, n = 7 mice; no ablation, n = 4 mice; independent samples two-tailed t-test, t = 12.3, P = 6.2 × 10⁻⁷). Bar plots show the mean with individual data points overlaid. Error bars show the standard error of the mean. *, P < 0.05; **, P < 0.01; ***, P < 0.001.

