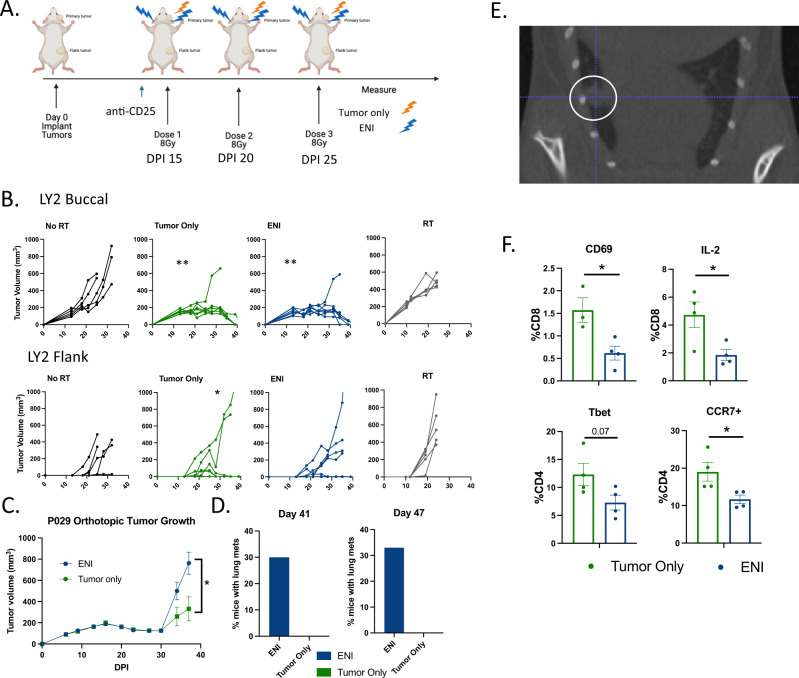
Fig. 1. ENI ablates the immune response to combined radiation and immunotherapy.
A Schematic of the experimental design for gross tumor irradiation with or without elective nodal irradiation (ENI). Mice were implanted both in the buccal and in the flank on day 0 post-implantation (DPI). Stereotactic body irradiation (SBRT) was given when tumors reached ~150mm3 and anti-CD25 was given a day before SBRT. Created with BioRender.com. B Tumor growth curves, from the experiment depicted in (A), Buccal tumor (top) and flank tumor growth curves (bottom) for mice treated with anti-CD25 (n = 5), anti-CD25 and tumor only SBRT (n = 7), anti-CD25 and ENI (n = 7), and tumor only SBRT alone (n = 5). C Buccal tumor growth curves for mice implanted with the P029 cell line (n = 10 per group). Mice were implanted in the buccal on day 0 post-implantation (DPI). SBRT was given when tumors reached ~150mm3 and anti-CD25 was given a day before SBRT and once a week thereafter. The doses of SBRT were spaced by 4–5 days. D Quantification of the percentage of mice with P029 tumors that had radiographically detectable lung metastases at days 41 (ENI, n = 10; tumor only, n = 7) and 47 (ENI, n = 9; tumor only, n = 7) post-tumor cell implantation. Lung metastases were evaluated by microCT images. E A representative microCT image of a lung metastasis identified in a mouse treated with ENI in the P029 model. A metastasis is highlighted with a white circle. F Flow cytometry analysis of blood taken from mice at day 24 DPI in the experiment depicted in (A) (ENI, n = 4; tumor only, n = 4). CD8 T cells were defined as CD45+CD3+CD8+ and CD4 T cells were defined as CD45+CD3+CD4+. For tumor growth at different time points, 3 or more groups differences were determined by a One-Way ANOVA test with Tukey’s post hoc comparisons, with only 2 groups a Two-Way ANOVA was used. To test if there is a difference between tumor only SBRT and ENI treatment groups in reducing the number of mice that grew flank tumors, we used a Fischer’s Exact test. For the flow cytometry analysis, a two-tailed student’s t-test was used. Significance was determined if the p-value was <0.05* and <0.01**. The error bars represent the standard error of the mean (± SEM). Source data are provided as a Source Data file. p-values are indicated for figures B. buccal tumor only **0.0035, buccal ENI **0.0032, *0.0278, (C) *0.0371, and (F) CD69 *0.0222, IL-2 *0.0284, CCR7 *0.0366.

