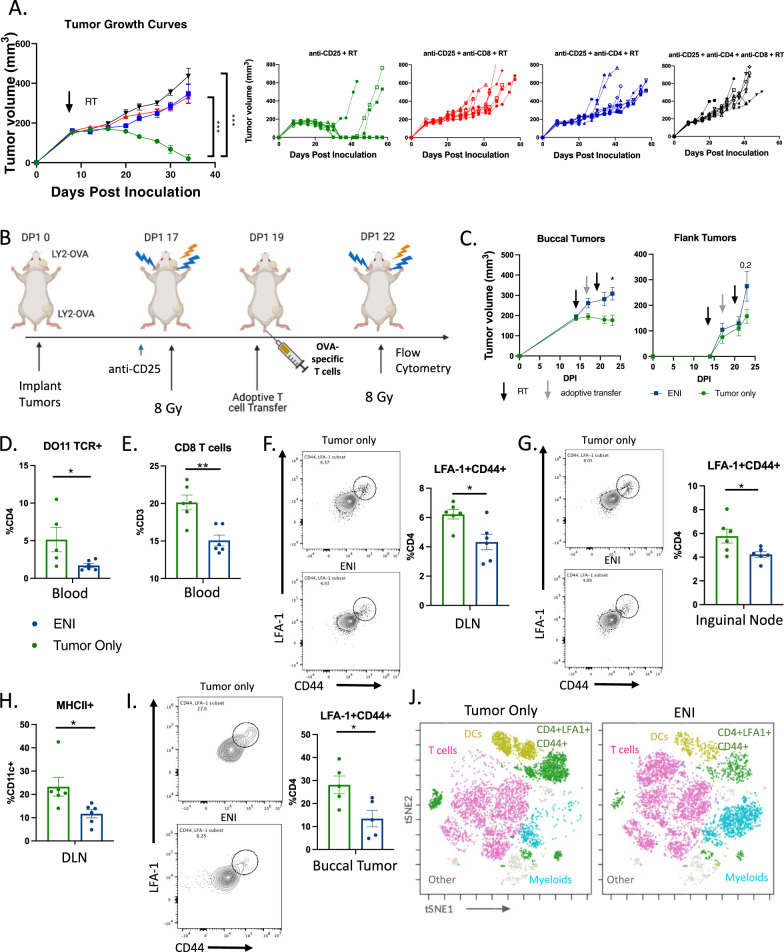
Fig. 2. ENI decreases antigen-experienced T cell expansion in the DLNs and infiltration into the TME.
A Tumor growth curves of mice depleted of CD4 T cells, CD8 T cells, both CD4 and CD8 T cells, or neither before tumor implantation (n = 10 for all groups). Mice with LY2 tumors were treated with 10 Gy × 1 SBRT to the tumor only when the tumors reached ~200mm3 and treated with anti-CD25. B Schematic of experimental design. OVA-specific T cells (1 × 10⁵ cells) were adoptively transferred into the mice via tail vein injection after the first dose of SBRT. At day 23 post-tumor cell implantation tumors, DLNs, and blood were harvested for flow cytometry. Created with BioRender.com. C Buccal and flank tumor growth curves for the experiment described in (B) (tumor only, n = 7; ENI n = 10). D Quantification of the percentage of CD4 T cells (CD45+CD3+CD4+) in the blood that were also DO11 TCR+ (tumor only, n = 5; ENI n = 6). E Quantification of CD8 T cells (CD45+CD3+CD8+) in the blood (tumor only, n = 6; ENI n = 6). F Flow plots and quantification of CD4+LFA−1+CD44+ T cells in the primary tumor DLN (tumor only, n = 6; ENI n = 6). G Flow plots and quantification of LFA1+CD44+CD4 T cells in the inguinal node (tumor only, n = 6; ENI n = 6). H Quantification of DCs (CD45+CD3−CD11c+MHCII+) in the primary tumor DLN (tumor only, n = 6; ENI n = 6). I Flow plots and quantification of LFA-1+CD44+ T cells in the buccal tumor (tumor only, n = 5; ENI n = 5). J t-SNE with FlowSOM population overlay of multi-spectral flow cytometry data (tumor only, n = 6; ENI n = 6). T cells (pink) were defined by expression of CD3 and CD4 or CD8, dendritic cells (DCs) (gold) were defined by CD3−CD11c+MHCII+ cells, CD4+LFA−1+CD44+ T cells (green) were defined by expression of CD4, LFA−1 and CD44, and myeloid cells (light blue) was defined by CD3−CD11c− cells. For tumor growth at selected time points, 3 or more groups differences were determined by a One-Way ANOVA test with Tukey’s post hoc comparisons, with only 2 groups a mixed-effects model was used. For the flow cytometry analysis, a two-tailed student’s t test was used. Significance was determined if the p-value was <0.05*, <0.01**, and <0.001***. The error bars represent the standard error of the mean (±SEM). Source data are provided as a Source Data file. p-values are indicated for figures A.**0.0014, CD8 depletion ***0.0002, double depletion ***0.0001 C. *0.0183, D. *0.0478, E. **0.002, F. *0.0125, G. *0.0366, H. *0.024, and I. *0.252.

