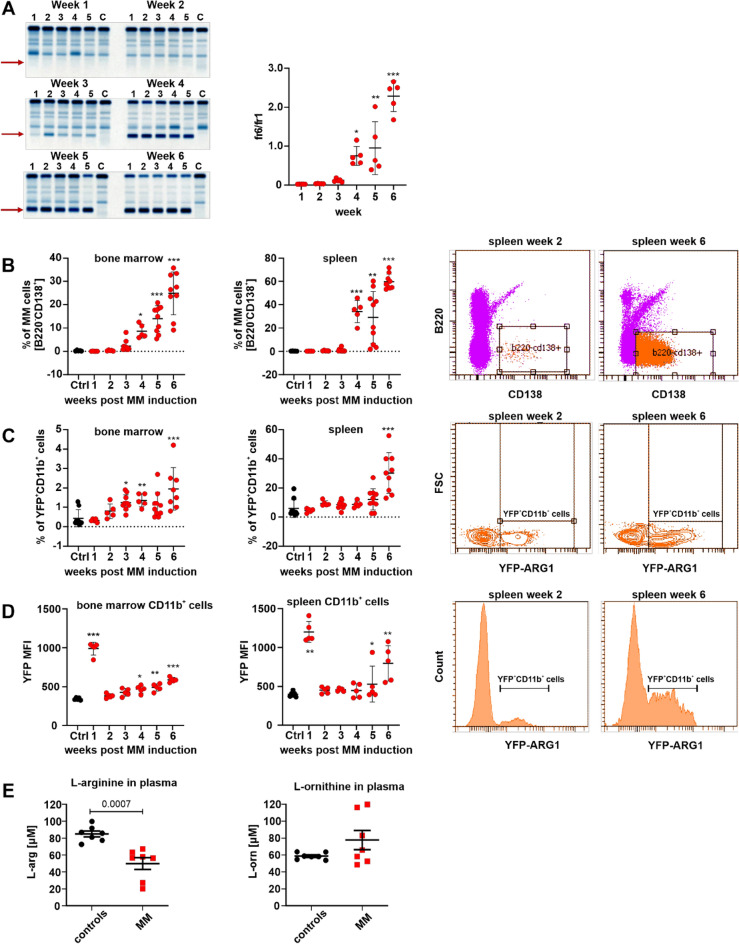
Figure 1.
Vĸ*MYC MM progression in mice is associated with increased expression of ARG1-expressing myeloid cells in the bone marrow and spleen and decreased serum ʟ-arg concentration. YARG mice were inoculated i.v. with 1 × 10⁶ of Vĸ*MYC cells. (A) Increase in the monoclonal protein fraction in serum protein electrophoresis (left, red arrows) and fraction 6 (monoclonal protein)-to-fraction 1 (albumins) ratio (right) in time; C—control YARG mouse not inoculated with Vĸ*MYC cells. *P = 0.0224; **P = 0.0013, ***P < 0.0001 vs week 1; one-way ANOVA with Dunnett’s post-hoc test. (B) Percentage of MM cells (live CD45+B220-CD138+) in the bone marrow (left) and spleen (middle left) of Vĸ*MYC-bearing mice in time evaluated in flow cytometry, ctrl—YARG mice not inoculated with Vĸ*MYC cells. *P = 0.0485; **P = 0.0001, ***P < 0.0001 vs ctrl; one-way ANOVA with Dunnett’s post-hoc test. Representative spleen dot plots: week 2 (middle right) and week 6 (right). (C) Percentage of ARG1-expressing myeloid cells (YFP+CD11b+) in the bone marrow (left) and spleen (middle left) of Vĸ*MYC-bearing mice in time, ctrl—YARG mice not inoculated with Vĸ*MYC cells. *P = 0.0202; **P = 0.0343, ***P < 0.0001 vs ctrl; one-way ANOVA with Dunnett’s post-hoc test. Representative spleen dot plots: week 2 (middle right) and week 6 (right). (D) Mean fluorescence intensity (MFI) of YFP (ARG1) in the myeloid cells (live CD45+CD11b+) in the bone marrow (left) and spleen (right) of Vĸ*MYC-bearing mice in time, ctrl—YARG mice not inoculated with Vĸ*MYC cells. (left): *P = 0.0014; **P = 0.0002, ***P < 0.0001 vs ctrl; (middle left): *P = 0.0011; **P < 0.0001 vs ctrl; one-way ANOVA with Dunnett’s post-hoc test. Representative spleen histograms: week 2 (middle right) and week 6 (right). (E) Serum concentration of ʟ-arginine (left) and ʟ-ornithine (right) in Vĸ*MYC-bearing mice in the 6th week of MM development, ctrl—YARG mice not inoculated with Vĸ*MYC cells; P-value was calculated with unpaired two-tailed t-test. All graphs present means ± SD, n = 5–9.

