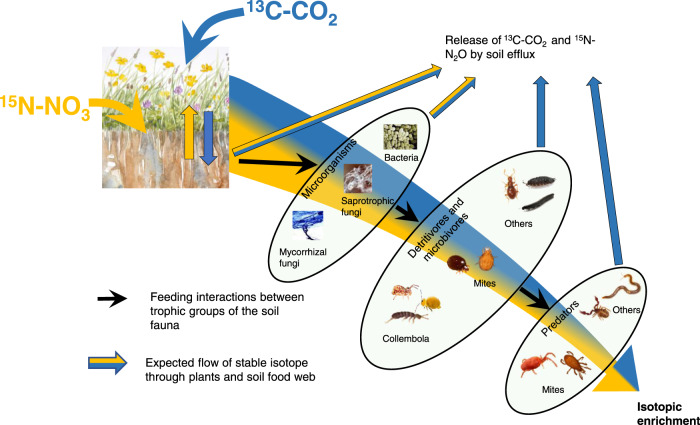
Fig. 1. The expected paths of C and N tracers in the plant-soil system.
Conceptual diagram of the expected flow of 13C (blue) and 15N (yellow) through plants and soil trophic groups. The figure represents the groups we analysed for their 13C and 15N content, hence the simplification of the food web. The ellipses represent the trophic groups, and although interactions within trophic groups can happen, the main flow of stable isotope will be from one trophic group to another (represented by arrows). The isotopic enrichment is expected to decrease at higher trophic levels of the food web. Grassland illustration by J. C. Bardgett, pictures from P. Lebeaux (www.animailes.com) and M. Chomel.

