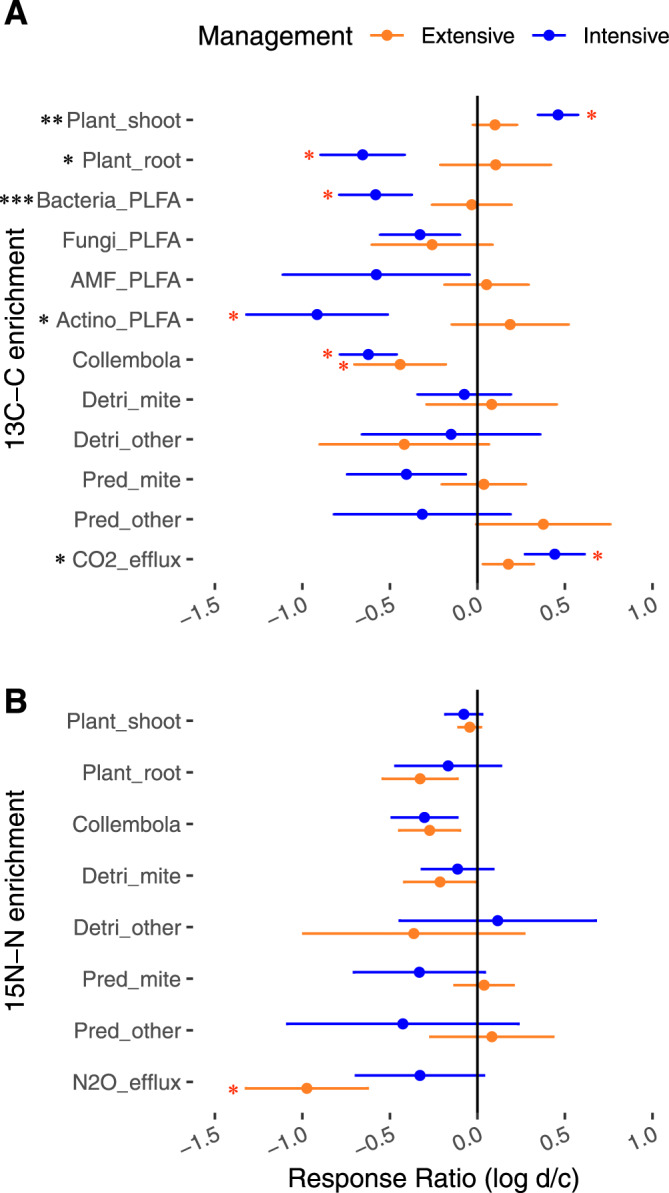
Fig. 2. Management impact on the drought effect on tracer transfer in the plant-soil system.

Response ratio of the post-drought effect on the 13C (A) or 15N (B) enrichment of the different pools as a function of grassland management (log (drought/control)). The sign (positive or negative) of the logRR corresponds to the direction of the drought effect on the 13C or 15N enrichment, while a response ratio of zero indicates no post-drought effect. This figure only highlights the strongest effects as logRR values have been calculated on averaged 13C or 15N enrichment across all sampling dates. Dots represent mean ± SEM (n = 18). Significance for management effect on the logRR from two sided linear mixed-models are reported with ***P < 0.01, **P < 0.01, *P < 0.05. Red asterisks indicate significance for drought effect by the examination of the confidence intervals of predicted means from the linear mixed-effects models, see Supplementary Table 1 for details. amf_PLFA AM fungal PLFA, actino_PLFA actinobacteria PLFA, detri_mites decomposer mites, detri_other other decomposers, pred_mite predatory mites, pred_other other predators.
