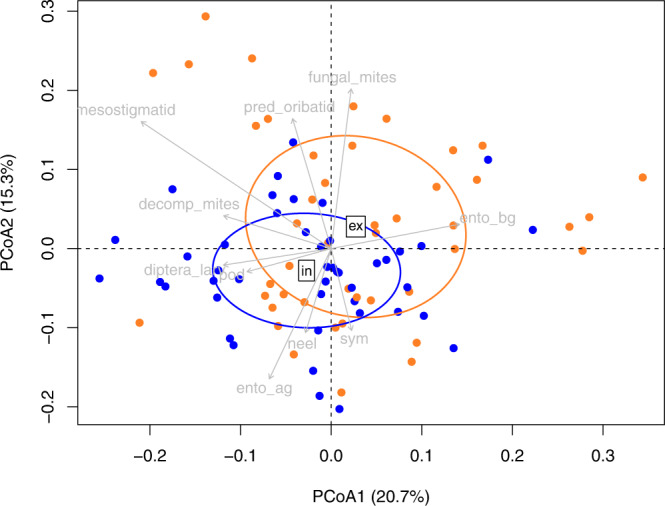
Fig. 3. Grassland management impact on soil food web.

Principal coordinates analysis (PCoA) of soil food web communities from grasslands with different land management (extensive in orange, intensive in blue) from the control plots at 5 sampling date (n = 90). The PCoA was based on Bray–Curtis distance using soil mesofauna abundances (individuals m−2) and PLFA biomass (g m−2). Grey arrows show the correlation vectors of the variables with the ordination. Significance was tested by Monte Carlo permutation against 999 random datasets and variables with P > 0.05 were kept (see Supplementary Table 2). Ento_ag epigeic entomobryomorpha, ento_bg eudaphic entomorbyomorpha, pod poduromorpha, sym symphypleona, neel neelipleona, decomp_mites decomposer mites, fungal_mites fungivorous mites, pred_oribatids predatory oribatids, pred_col_ad predatory coleoptera, pred_col_larv predatory coleoptera larvae, detrit_col_ad detritivorous coleoptera, detrit_col_larv detritivorous coleoptera larvae, diptera_larv diptera larvae, bactplfa bacterial PLFA, fungplfa fungal PLFA, amfplfa AM fungal PLFA, actinoplfa actinobacteria PLFA.
