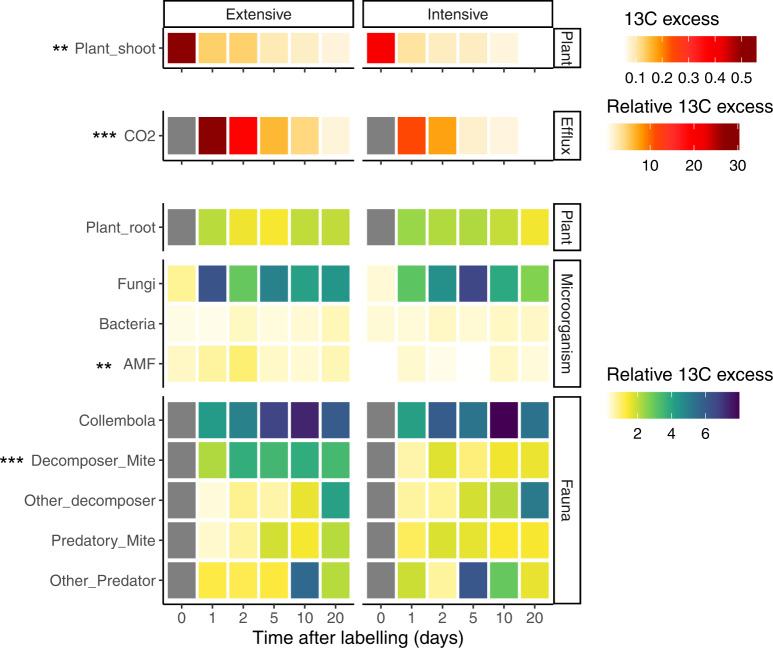
Fig. 4. Management impact on the 13C transfer in the plant-soil system.
Temporal dynamics of 13C in the plant shoot (upper panel), soil CO2 efflux (middle panel) and below-ground pools (lower panel) following 13C pulse labelling (time 0) from the control plots (n = 108). The heat map shows the 13C-enrichment in different pools and fluxes in grassland under extensive (left) or intensive (right) management. The plant shoot enrichment is expressed in atom % excess; however, to be able to compare the flux of C from the plant to below-ground, all the other variables are expressed relative to the initial 13C fixed by the plants (relative 13C excess, %). Note difference in scales to visualise the relative enrichments. The difference between management and time was tested using two-sided mixed models. Results of the effect of the grassland management are reported with ***P < 0.01, **P < 0.01, *P < 0.05, see Supplementary Table 3 for detailed statistical results. Grey colour indicates no data available.

