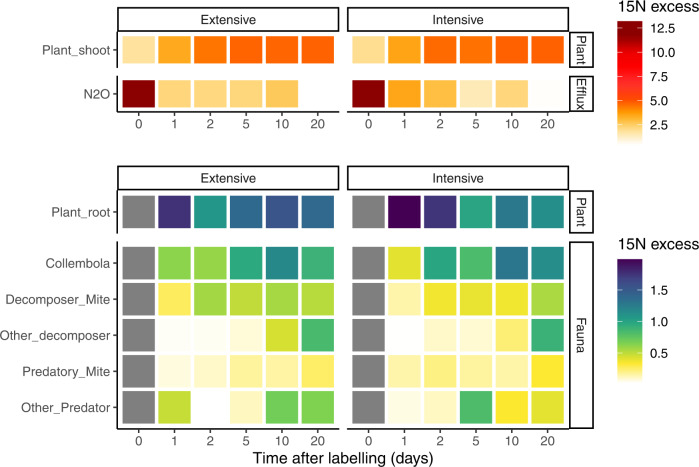
Fig. 5. Management impact on the 15N transfer in the plant-soil system.
Temporal dynamics of 15N atom % excess above-ground (upper panel) and below-ground (lower panel) in plant and soil fauna following 15N pulse labelling from the control plots (n = 108). The heat map shows the 15N atom % excess in the different groups in grassland under extensive (left) or intensive (right) management. Note difference in scales between the two panels as the enrichment of above-ground nitrogen pools and fluxes are substantially greater than any of the below-ground pools. The difference between management and time was tested using two-sided mixed models. There were no significant effects of grassland management: see Supplementary Table 3 for detailed statistical results. Grey colour indicates no data available.

